The Development of Neural Network Based System Identification ...
The Development of Neural Network Based System Identification ...
The Development of Neural Network Based System Identification ...

You also want an ePaper? Increase the reach of your titles
YUMPU automatically turns print PDFs into web optimized ePapers that Google loves.
124 CHAPTER 5 NN BASED SYSTEM IDENTIFICATION: RESULTS AND DISCUSSION<br />
in Figure 5.3(c) shows that the weights gradually increase and remain constant beyond<br />
iteration point i = 185. <strong>The</strong> network training ends much quicker compared with the<br />
network training without regularisation term since the weights do not change after<br />
i = 185. <strong>The</strong> MSE calculation on the validation data set also shows that the optimum<br />
weights are found at i = 185, thus demonstrating the effectiveness <strong>of</strong> the regularisation<br />
method to prevent the over-fitting problem. <strong>The</strong> effect <strong>of</strong> using the regularisation term<br />
basically introduces a smoothing effect on the error criterion V N (θ, Z N ) in such a way<br />
that weights that have less important influence on error are forced to decay towards<br />
zero [Samarasinghe, 2007]. In this process, only the important weights that minimise<br />
the error are allowed to grow and stabilise at their optimum values.<br />
<strong>The</strong> MSE result for network training with large regularisation parameter α = 0.8<br />
is shown in Figure 5.3(f). <strong>The</strong> figure indicates that the network training stops much<br />
earlier than the network training with α = 0 and α = 0.0001. However, the network<br />
model has higher MSE values in both training and validation data. Further increase in<br />
regularisation parameter would make the weights less adaptable as the weights only<br />
grow in limited small magnitude (±1.5). This would make the network less flexible and<br />
would result in poor prediction performance due to severe bias.<br />
5.2.2 Model Structure Selection Results<br />
<strong>The</strong> optimum model structure can be found using the Lipschitz coefficient, and it is<br />
possible to determine the proper lag space via experimental data [Norgaard, 2000].<br />
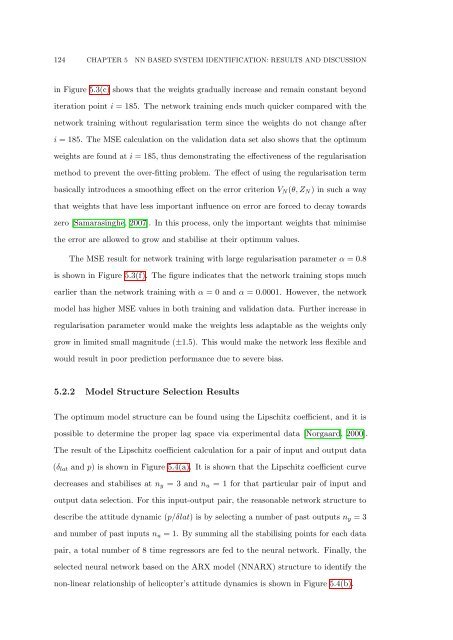
<strong>The</strong> result <strong>of</strong> the Lipschitz coefficient calculation for a pair <strong>of</strong> input and output data<br />
(δ lat and p) is shown in Figure 5.4(a). It is shown that the Lipschitz coefficient curve<br />
decreases and stabilises at n y = 3 and n u = 1 for that particular pair <strong>of</strong> input and<br />
output data selection. For this input-output pair, the reasonable network structure to<br />
describe the attitude dynamic (p/δlat) is by selecting a number <strong>of</strong> past outputs n y = 3<br />
and number <strong>of</strong> past inputs n u = 1. By summing all the stabilising points for each data<br />
pair, a total number <strong>of</strong> 8 time regressors are fed to the neural network. Finally, the<br />
selected neural network based on the ARX model (NNARX) structure to identify the<br />
non-linear relationship <strong>of</strong> helicopter’s attitude dynamics is shown in Figure 5.4(b).