The Development of Neural Network Based System Identification ...
The Development of Neural Network Based System Identification ...
The Development of Neural Network Based System Identification ...

You also want an ePaper? Increase the reach of your titles
YUMPU automatically turns print PDFs into web optimized ePapers that Google loves.
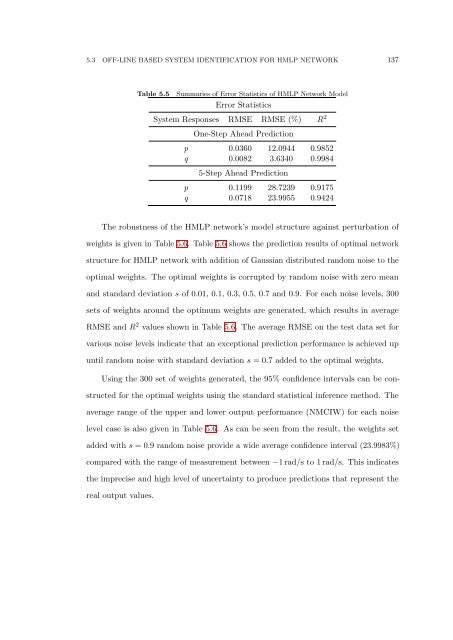
5.3 OFF-LINE BASED SYSTEM IDENTIFICATION FOR HMLP NETWORK 137<br />
Table 5.5<br />
Summaries <strong>of</strong> Error Statistics <strong>of</strong> HMLP <strong>Network</strong> Model<br />
Error Statistics<br />
<strong>System</strong> Responses RMSE RMSE (%) R 2<br />
One-Step Ahead Prediction<br />
p 0.0360 12.0944 0.9852<br />
q 0.0082 3.6340 0.9984<br />
5-Step Ahead Prediction<br />
p 0.1199 28.7239 0.9175<br />
q 0.0718 23.9955 0.9424<br />
<strong>The</strong> robustness <strong>of</strong> the HMLP network’s model structure against perturbation <strong>of</strong><br />
weights is given in Table 5.6. Table 5.6 shows the prediction results <strong>of</strong> optimal network<br />
structure for HMLP network with addition <strong>of</strong> Gaussian distributed random noise to the<br />
optimal weights. <strong>The</strong> optimal weights is corrupted by random noise with zero mean<br />
and standard deviation s <strong>of</strong> 0.01, 0.1, 0.3, 0.5, 0.7 and 0.9. For each noise levels, 300<br />
sets <strong>of</strong> weights around the optimum weights are generated, which results in average<br />
RMSE and R 2 values shown in Table 5.6. <strong>The</strong> average RMSE on the test data set for<br />
various noise levels indicate that an exceptional prediction performance is achieved up<br />
until random noise with standard deviation s = 0.7 added to the optimal weights.<br />
Using the 300 set <strong>of</strong> weights generated, the 95% confidence intervals can be constructed<br />
for the optimal weights using the standard statistical inference method. <strong>The</strong><br />
average range <strong>of</strong> the upper and lower output performance (NMCIW) for each noise<br />
level case is also given in Table 5.6. As can be seen from the result, the weights set<br />
added with s = 0.9 random noise provide a wide average confidence interval (23.9983%)<br />
compared with the range <strong>of</strong> measurement between −1 rad/s to 1 rad/s. This indicates<br />
the imprecise and high level <strong>of</strong> uncertainty to produce predictions that represent the<br />
real output values.