The Development of Neural Network Based System Identification ...
The Development of Neural Network Based System Identification ...
The Development of Neural Network Based System Identification ...

You also want an ePaper? Increase the reach of your titles
YUMPU automatically turns print PDFs into web optimized ePapers that Google loves.
116 CHAPTER 4 NEURAL NETWORK BASED SYSTEM IDENTIFICATION<br />
y t 1<br />
y t 2 <br />
u t 1 <br />
u t 2 <br />
NN<br />
Prediction<br />
<br />
1 <br />
<br />
<br />
y t <br />
u t<br />
ut 1<br />
ŷ t<br />
NN<br />
Prediction<br />
<br />
<br />
<br />
<br />
t<br />
yˆ t 1<br />
u t 1<br />
u<br />
<br />
NN<br />
Prediction<br />
<br />
<br />
<br />
<br />
yt ˆ 1<br />
yˆ t 1<br />
u t 2<br />
u t 1<br />
<br />
<br />
<br />
<br />
<br />
yt ˆ 2<br />
NN<br />
Prediction<br />
<br />
<br />
yt ˆ 3<br />
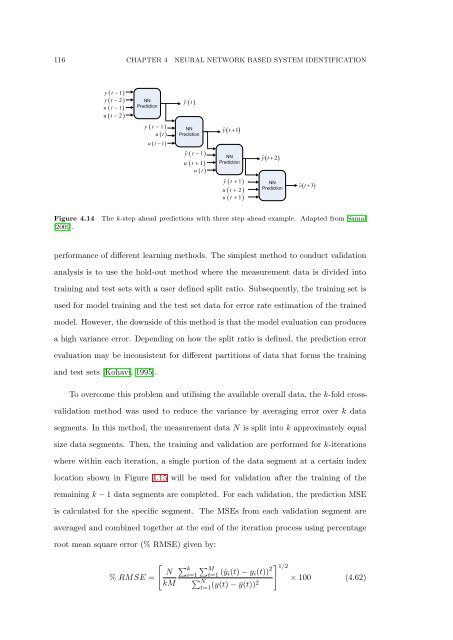
Figure 4.14<br />
[2009].<br />
<strong>The</strong> k-step ahead predictions with three step ahead example. Adapted from Samal<br />
performance <strong>of</strong> different learning methods. <strong>The</strong> simplest method to conduct validation<br />
analysis is to use the hold-out method where the measurement data is divided into<br />
training and test sets with a user defined split ratio. Subsequently, the training set is<br />
used for model training and the test set data for error rate estimation <strong>of</strong> the trained<br />
model. However, the downside <strong>of</strong> this method is that the model evaluation can produces<br />
a high variance error. Depending on how the split ratio is defined, the prediction error<br />
evaluation may be inconsistent for different partitions <strong>of</strong> data that forms the training<br />
and test sets [Kohavi, 1995].<br />
To overcome this problem and utilising the available overall data, the k-fold crossvalidation<br />
method was used to reduce the variance by averaging error over k data<br />
segments. In this method, the measurement data N is split into k approximately equal<br />
size data segments. <strong>The</strong>n, the training and validation are performed for k-iterations<br />
where within each iteration, a single portion <strong>of</strong> the data segment at a certain index<br />
location shown in Figure 4.15 will be used for validation after the training <strong>of</strong> the<br />
remaining k − 1 data segments are completed. For each validation, the prediction MSE<br />
is calculated for the specific segment. <strong>The</strong> MSEs from each validation segment are<br />
averaged and combined together at the end <strong>of</strong> the iteration process using percentage<br />
root mean square error (% RMSE) given by:<br />
% RMSE =<br />
[<br />
N<br />
kM<br />
∑ k<br />
i=1<br />
∑ M<br />
t=1 (ŷ i(t) − y i (t)) 2<br />
∑ N<br />
t=1 (y(t) − ȳ(t))2 ] 1/2<br />
× 100 (4.62)