The Development of Neural Network Based System Identification ...
The Development of Neural Network Based System Identification ...
The Development of Neural Network Based System Identification ...

You also want an ePaper? Increase the reach of your titles
YUMPU automatically turns print PDFs into web optimized ePapers that Google loves.
5.7 MODEL PERFORMANCE COMPARISON USING RECURSIVE TRAINING 149<br />
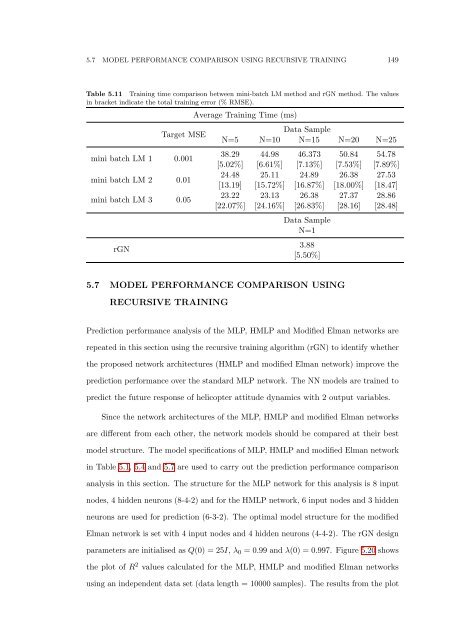
Table 5.11 Training time comparison between mini-batch LM method and rGN method. <strong>The</strong> values<br />
in bracket indicate the total training error (% RMSE).<br />
Target MSE<br />
mini batch LM 1 0.001<br />
mini batch LM 2 0.01<br />
mini batch LM 3 0.05<br />
rGN<br />
Average Training Time (ms)<br />
Data Sample<br />
N=5 N=10 N=15 N=20 N=25<br />
38.29 44.98 46.373 50.84 54.78<br />
[5.02%] [6.61%] [7.13%] [7.53%] [7.89%]<br />
24.48 25.11 24.89 26.38 27.53<br />
[13.19] [15.72%] [16.87%] [18.00%] [18.47]<br />
23.22 23.13 26.38 27.37 28.86<br />
[22.07%] [24.16%] [26.83%] [28.16] [28.48]<br />
Data Sample<br />
N=1<br />
3.88<br />
[5.50%]<br />
5.7 MODEL PERFORMANCE COMPARISON USING<br />
RECURSIVE TRAINING<br />
Prediction performance analysis <strong>of</strong> the MLP, HMLP and Modified Elman networks are<br />
repeated in this section using the recursive training algorithm (rGN) to identify whether<br />
the proposed network architectures (HMLP and modified Elman network) improve the<br />
prediction performance over the standard MLP network. <strong>The</strong> NN models are trained to<br />
predict the future response <strong>of</strong> helicopter attitude dynamics with 2 output variables.<br />
Since the network architectures <strong>of</strong> the MLP, HMLP and modified Elman networks<br />
are different from each other, the network models should be compared at their best<br />
model structure. <strong>The</strong> model specifications <strong>of</strong> MLP, HMLP and modified Elman network<br />
in Table 5.1, 5.4 and 5.7 are used to carry out the prediction performance comparison<br />
analysis in this section. <strong>The</strong> structure for the MLP network for this analysis is 8 input<br />
nodes, 4 hidden neurons (8-4-2) and for the HMLP network, 6 input nodes and 3 hidden<br />
neurons are used for prediction (6-3-2). <strong>The</strong> optimal model structure for the modified<br />
Elman network is set with 4 input nodes and 4 hidden neurons (4-4-2). <strong>The</strong> rGN design<br />
parameters are initialised as Q(0) = 25I, λ 0 = 0.99 and λ(0) = 0.997. Figure 5.20 shows<br />
the plot <strong>of</strong> R 2 values calculated for the MLP, HMLP and modified Elman networks<br />
using an independent data set (data length = 10000 samples). <strong>The</strong> results from the plot