- Page 1:
The Development of Neural Network B
- Page 5 and 6:
ABSTRACT This thesis presents the d
- Page 7:
vii the MLP network, the prediction
- Page 11:
PUBLICATIONS The following is a lis
- Page 14 and 15:
xiv TABLE OF CONTENTS CHAPTER 4 CHA
- Page 17 and 18:
LIST OF FIGURES 1.1 Examples of typ
- Page 19 and 20:
LIST OF FIGURES xix 3.13 Overview o
- Page 21 and 22:
LIST OF FIGURES xxi 5.2 The predict
- Page 23 and 24:
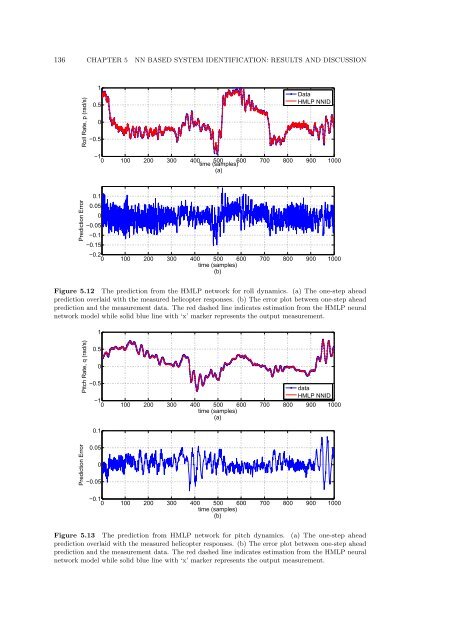
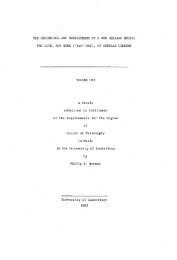
LIST OF FIGURES xxiii 5.13 The pred
- Page 25 and 26:
LIST OF FIGURES xxv 7.1 The locatio
- Page 27 and 28:
LIST OF TABLES 3.1 The specificatio
- Page 29 and 30:
NOMENCLATURE AFCS Automatic Flight
- Page 31:
LIST OF TABLES xxxi NNARX QP RBF RC
- Page 34 and 35:
2 CHAPTER 1 INTRODUCTION Surveillan
- Page 36 and 37:
4 CHAPTER 1 INTRODUCTION is then de
- Page 38 and 39:
6 CHAPTER 1 INTRODUCTION the dynami
- Page 40 and 41:
8 CHAPTER 1 INTRODUCTION models [Sa
- Page 42 and 43:
10 CHAPTER 1 INTRODUCTION improved
- Page 44 and 45:
12 CHAPTER 1 INTRODUCTION Chapter 3
- Page 47 and 48:
Chapter 2 LITERATURE REVIEW The pur
- Page 49 and 50:
2.1 INTRODUCTION 17 • Inefficient
- Page 51 and 52:
2.1 INTRODUCTION 19 Figure 2.2 The
- Page 53 and 54:
2.2 HELICOPTER DYNAMICS MODELLING A
- Page 55 and 56:
2.2 HELICOPTER DYNAMICS MODELLING A
- Page 57 and 58:
2.2 HELICOPTER DYNAMICS MODELLING A
- Page 59 and 60:
2.3 NEURAL NETWORK BASED SYSTEM IDE
- Page 61 and 62:
2.3 NEURAL NETWORK BASED SYSTEM IDE
- Page 63 and 64:
2.3 NEURAL NETWORK BASED SYSTEM IDE
- Page 65 and 66:
2.3 NEURAL NETWORK BASED SYSTEM IDE
- Page 67 and 68:
2.3 NEURAL NETWORK BASED SYSTEM IDE
- Page 69 and 70:
2.4 AUTOMATIC FLIGHT CONTROL SYSTEM
- Page 71 and 72:
2.4 AUTOMATIC FLIGHT CONTROL SYSTEM
- Page 73 and 74:
2.4 AUTOMATIC FLIGHT CONTROL SYSTEM
- Page 75 and 76:
2.4 AUTOMATIC FLIGHT CONTROL SYSTEM
- Page 77 and 78:
2.4 AUTOMATIC FLIGHT CONTROL SYSTEM
- Page 79 and 80:
2.4 AUTOMATIC FLIGHT CONTROL SYSTEM
- Page 81 and 82:
2.4 AUTOMATIC FLIGHT CONTROL SYSTEM
- Page 83 and 84:
2.4 AUTOMATIC FLIGHT CONTROL SYSTEM
- Page 85:
2.5 SUMMARY 53 design based on the
- Page 88 and 89:
56 CHAPTER 3 AERIAL PLATFORM AND CU
- Page 90 and 91:
58 CHAPTER 3 AERIAL PLATFORM AND CU
- Page 92 and 93:
60 CHAPTER 3 AERIAL PLATFORM AND CU
- Page 94 and 95:
62 CHAPTER 3 AERIAL PLATFORM AND CU
- Page 96 and 97:
64 CHAPTER 3 AERIAL PLATFORM AND CU
- Page 98 and 99:
66 CHAPTER 3 AERIAL PLATFORM AND CU
- Page 100 and 101:
68 CHAPTER 3 AERIAL PLATFORM AND CU
- Page 102 and 103:
70 CHAPTER 3 AERIAL PLATFORM AND CU
- Page 104 and 105:
72 CHAPTER 3 AERIAL PLATFORM AND CU
- Page 106 and 107:
74 CHAPTER 3 AERIAL PLATFORM AND CU
- Page 109 and 110:
Chapter 4 NEURAL NETWORK BASED SYST
- Page 111 and 112:
4.2 THE ARTIFICIAL NEURAL NETWORKS
- Page 113 and 114:
4.2 THE ARTIFICIAL NEURAL NETWORKS
- Page 115 and 116:
4.2 THE ARTIFICIAL NEURAL NETWORKS
- Page 117 and 118: 4.2 THE ARTIFICIAL NEURAL NETWORKS
- Page 119 and 120: 4.2 THE ARTIFICIAL NEURAL NETWORKS
- Page 121 and 122: 4.2 THE ARTIFICIAL NEURAL NETWORKS
- Page 123 and 124: 4.3 SYSTEM IDENTIFICATION WITH NEUR
- Page 125 and 126: 4.3 SYSTEM IDENTIFICATION WITH NEUR
- Page 127 and 128: 4.3 SYSTEM IDENTIFICATION WITH NEUR
- Page 129 and 130: 4.3 SYSTEM IDENTIFICATION WITH NEUR
- Page 131 and 132: 4.3 SYSTEM IDENTIFICATION WITH NEUR
- Page 133 and 134: 4.3 SYSTEM IDENTIFICATION WITH NEUR
- Page 135 and 136: 4.3 SYSTEM IDENTIFICATION WITH NEUR
- Page 137 and 138: 4.3 SYSTEM IDENTIFICATION WITH NEUR
- Page 139 and 140: 4.3 SYSTEM IDENTIFICATION WITH NEUR
- Page 141 and 142: 4.3 SYSTEM IDENTIFICATION WITH NEUR
- Page 143 and 144: 4.3 SYSTEM IDENTIFICATION WITH NEUR
- Page 145 and 146: 4.3 SYSTEM IDENTIFICATION WITH NEUR
- Page 147 and 148: 4.3 SYSTEM IDENTIFICATION WITH NEUR
- Page 149 and 150: 4.4 SUMMARY 117 Segment 1 Segment 2
- Page 151 and 152: Chapter 5 NN BASED SYSTEM IDENTIFIC
- Page 153 and 154: 5.2 OFF-LINE BASED SYSTEM IDENTIFIC
- Page 155 and 156: 5.2 OFF-LINE BASED SYSTEM IDENTIFIC
- Page 157 and 158: 5.2 OFF-LINE BASED SYSTEM IDENTIFIC
- Page 159 and 160: 5.2 OFF-LINE BASED SYSTEM IDENTIFIC
- Page 161 and 162: 5.2 OFF-LINE BASED SYSTEM IDENTIFIC
- Page 163 and 164: 5.2 OFF-LINE BASED SYSTEM IDENTIFIC
- Page 165 and 166: 5.3 OFF-LINE BASED SYSTEM IDENTIFIC
- Page 167: 5.3 OFF-LINE BASED SYSTEM IDENTIFIC
- Page 171 and 172: 5.4 OFF-LINE BASED SYSTEM IDENTIFIC
- Page 173 and 174: 5.4 OFF-LINE BASED SYSTEM IDENTIFIC
- Page 175 and 176: 5.4 OFF-LINE BASED SYSTEM IDENTIFIC
- Page 177 and 178: 5.6 ON-LINE SYSTEM IDENTIFICATION 1
- Page 179 and 180: 5.6 ON-LINE SYSTEM IDENTIFICATION 1
- Page 181 and 182: 5.7 MODEL PERFORMANCE COMPARISON US
- Page 183 and 184: 5.8 SUMMARY 151 methods such as wei
- Page 185: 5.8 SUMMARY 153 would enable the im
- Page 188 and 189: 156 CHAPTER 6 NEURAL NETWORK BASED
- Page 190 and 191: 158 CHAPTER 6 NEURAL NETWORK BASED
- Page 192 and 193: 160 CHAPTER 6 NEURAL NETWORK BASED
- Page 194 and 195: 162 CHAPTER 6 NEURAL NETWORK BASED
- Page 196 and 197: 164 CHAPTER 6 NEURAL NETWORK BASED
- Page 198 and 199: 166 CHAPTER 6 NEURAL NETWORK BASED
- Page 200 and 201: 168 CHAPTER 6 NEURAL NETWORK BASED
- Page 202 and 203: 170 CHAPTER 6 NEURAL NETWORK BASED
- Page 204 and 205: 172 CHAPTER 6 NEURAL NETWORK BASED
- Page 206 and 207: 174 CHAPTER 6 NEURAL NETWORK BASED
- Page 208 and 209: 176 CHAPTER 6 NEURAL NETWORK BASED
- Page 210 and 211: 178 CHAPTER 6 NEURAL NETWORK BASED
- Page 212 and 213: 180 CHAPTER 6 NEURAL NETWORK BASED
- Page 215 and 216: Chapter 7 FLIGHT CONTROL SYSTEM DES
- Page 217 and 218: 7.2 FLIGHT TESTS IMPLEMENTATION 185
- Page 219 and 220:
7.3 EXPERIMENTAL RESULTS 187 1 0.8
- Page 221 and 222:
7.3 EXPERIMENTAL RESULTS 189 Longit
- Page 223 and 224:
7.3 EXPERIMENTAL RESULTS 191 Pitch
- Page 225 and 226:
7.3 EXPERIMENTAL RESULTS 193 Flight
- Page 227 and 228:
7.3 EXPERIMENTAL RESULTS 195 140 Ya
- Page 229 and 230:
7.3 EXPERIMENTAL RESULTS 197 indica
- Page 231 and 232:
7.3 EXPERIMENTAL RESULTS 199 20 100
- Page 233 and 234:
7.3 EXPERIMENTAL RESULTS 201 Yaw Ra
- Page 235 and 236:
7.3 EXPERIMENTAL RESULTS 203 mainta
- Page 237 and 238:
7.3 EXPERIMENTAL RESULTS 205 Yaw Ra
- Page 239:
7.4 SUMMARY 207 data measured from
- Page 242 and 243:
210 CHAPTER 8 CONCLUSIONS AND FUTUR
- Page 244 and 245:
212 CHAPTER 8 CONCLUSIONS AND FUTUR
- Page 246 and 247:
214 REFERENCES B. W. Bequette. Non-
- Page 248 and 249:
216 REFERENCES Konstantinos Dalamag
- Page 250 and 251:
218 REFERENCES Wayne Johnson. Helic
- Page 252 and 253:
220 REFERENCES B. Mettler, Mark B.
- Page 254 and 255:
222 REFERENCES V. R. Puttige and S.
- Page 256 and 257:
224 REFERENCES D.H. Shim. Hierarchi
- Page 258 and 259:
226 REFERENCES Nikos Vitzilaios and