The Development of Neural Network Based System Identification ...
The Development of Neural Network Based System Identification ...
The Development of Neural Network Based System Identification ...

You also want an ePaper? Increase the reach of your titles
YUMPU automatically turns print PDFs into web optimized ePapers that Google loves.
5.4 OFF-LINE BASED SYSTEM IDENTIFICATION FOR ELMAN NETWORK 141<br />
Roll Rate, p (rad/s)<br />
1.5<br />
1<br />
0.5<br />
0<br />
−0.5<br />
data<br />
Elman NNID<br />
−1<br />
0 100 200 300 400 500 600 700 800 900 1000<br />
time (samples)<br />
(a)<br />
0.2<br />
Prediction Error<br />
0.1<br />
0<br />
−0.1<br />
−0.2<br />
0 100 200 300 400 500 600 700 800 900 1000<br />
time (samples)<br />
(b)<br />
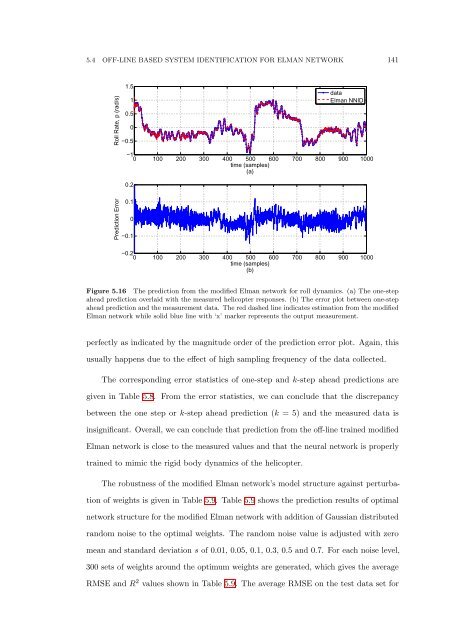
Figure 5.16 <strong>The</strong> prediction from the modified Elman network for roll dynamics. (a) <strong>The</strong> one-step<br />
ahead prediction overlaid with the measured helicopter responses. (b) <strong>The</strong> error plot between one-step<br />
ahead prediction and the measurement data. <strong>The</strong> red dashed line indicates estimation from the modified<br />
Elman network while solid blue line with ‘x’ marker represents the output measurement.<br />
perfectly as indicated by the magnitude order <strong>of</strong> the prediction error plot. Again, this<br />
usually happens due to the effect <strong>of</strong> high sampling frequency <strong>of</strong> the data collected.<br />
<strong>The</strong> corresponding error statistics <strong>of</strong> one-step and k-step ahead predictions are<br />
given in Table 5.8. From the error statistics, we can conclude that the discrepancy<br />
between the one step or k-step ahead prediction (k = 5) and the measured data is<br />
insignificant. Overall, we can conclude that prediction from the <strong>of</strong>f-line trained modified<br />
Elman network is close to the measured values and that the neural network is properly<br />
trained to mimic the rigid body dynamics <strong>of</strong> the helicopter.<br />
<strong>The</strong> robustness <strong>of</strong> the modified Elman network’s model structure against perturbation<br />
<strong>of</strong> weights is given in Table 5.9. Table 5.9 shows the prediction results <strong>of</strong> optimal<br />
network structure for the modified Elman network with addition <strong>of</strong> Gaussian distributed<br />
random noise to the optimal weights. <strong>The</strong> random noise value is adjusted with zero<br />
mean and standard deviation s <strong>of</strong> 0.01, 0.05, 0.1, 0.3, 0.5 and 0.7. For each noise level,<br />
300 sets <strong>of</strong> weights around the optimum weights are generated, which gives the average<br />
RMSE and R 2 values shown in Table 5.9. <strong>The</strong> average RMSE on the test data set for