- Page 1 and 2:
UAD POWERED PLUG-INS USER MANUAL VE
- Page 3 and 4:
Universal Audio, Inc. End-User Lice
- Page 5 and 6:
TABLE OF CONTENTS Demo Mode . . . .
- Page 7 and 8:
TABLE OF CONTENTS Chapter 12. LA-3A
- Page 9 and 10:
TABLE OF CONTENTS Chapter 21. Preci
- Page 11 and 12:
TABLE OF CONTENTS Resonance (Equali
- Page 13 and 14:
TABLE OF CONTENTS Chapter 40. Littl
- Page 15 and 16:
The UAD-2 also introduces version 5
- Page 17 and 18:
The UAD System The UAD Powered Plug
- Page 19 and 20:
When the content of and function of
- Page 21 and 22:
CHAPTER 2 UAD Installation Overview
- Page 23 and 24:
For detailed technical information
- Page 25 and 26:
• a) Select the “Install the so
- Page 27 and 28:
PCI/PCI-X: UAD-1 only PCI Express (
- Page 29 and 30:
Note: The following procedure requi
- Page 31 and 32:
•If you already have a my.uaudio.
- Page 33 and 34:
Learn More Software Removal After i
- Page 35 and 36:
Note: Multiple UAD hardware types c
- Page 37 and 38:
The UAD Software The UAD Powered Pl
- Page 39 and 40:
The DAW Environment The digital aud
- Page 41 and 42:
I/O Drivers The audio interface is
- Page 43 and 44:
Bundled Plug-Ins UAD plug-ins that
- Page 45 and 46:
My Systems The UAD cards and plug-i
- Page 47 and 48:
2. Launch the UAD Meter & Control P
- Page 49 and 50:
Buying Plug-Ins To obtain optional
- Page 51 and 52:
CHAPTER 5 Using Multiple UAD Cards
- Page 53 and 54:
Important: If insufficient power is
- Page 55 and 56:
CHAPTER 6 UAD Meter & Control Panel
- Page 57 and 58:
UAD Meter Elements Refer to Figure
- Page 59 and 60:
Click the Menu button Figure 8. Acc
- Page 61 and 62:
UAD-2 The displayed latency is the
- Page 63 and 64:
Status Column The Status column ref
- Page 65 and 66:
For example, you could run low-DSP
- Page 67 and 68:
With the Limit DSP Load feature, th
- Page 69 and 70:
AMD-8131 Compatible Mode is only re
- Page 71 and 72:
Use Host Mode When Use Host Mode is
- Page 73 and 74:
Pro Tools Configuration Window Figu
- Page 75 and 76:
Logic Pro Figure 16. Launching a UA
- Page 77 and 78:
Settings Menu The Settings menu pro
- Page 79 and 80:
Increased Host Loading using LiveTr
- Page 81 and 82:
Text Entry Parameter values can be
- Page 83 and 84:
Multi-DSP UAD-2 systems use signifi
- Page 85 and 86: CHAPTER 8 Tempo Sync Overview The t
- Page 87 and 88: Range Limits Some parameters in Tem
- Page 89 and 90: Roland RE-201 Sync When the RE-201i
- Page 91 and 92: Table 6. Host Application plug-in d
- Page 93 and 94: The UAD Delay Compensator acts as a
- Page 95 and 96: UAD Track Advance Overview The prev
- Page 97 and 98: Solution: Put a TrackAdv plug-in on
- Page 99 and 100: Upsampled Compensation Examples Gro
- Page 101 and 102: Live Processing The previous discus
- Page 103 and 104: In this chapter you will find instr
- Page 105 and 106: Note: Do not bend sharp angles into
- Page 107 and 108: UAD-Xpander Pre-Flight Check 1. Ens
- Page 109 and 110: 3. Turn off the power switch on the
- Page 111 and 112: CHAPTER 11 LA-2A and 1176LN Overvie
- Page 113 and 114: +10 0 Compression region 10 dB of c
- Page 115 and 116: LA-2A Controls Figure 30. The LA-2A
- Page 117 and 118: 1176LN Controls Figure 32. The 1176
- Page 119 and 120: 1176SE “Special Edition” Figure
- Page 121 and 122: LA-3A Controls Background Comp/Lim
- Page 123 and 124: Fairchild Screenshot Figure 35. The
- Page 125 and 126: Fairchild Modes Dual Left/Right Lat
- Page 127 and 128: Meter Select Switch This switch det
- Page 129 and 130: DC Bias DC Bias controls the ratio
- Page 131 and 132: Precision Multiband Interface The P
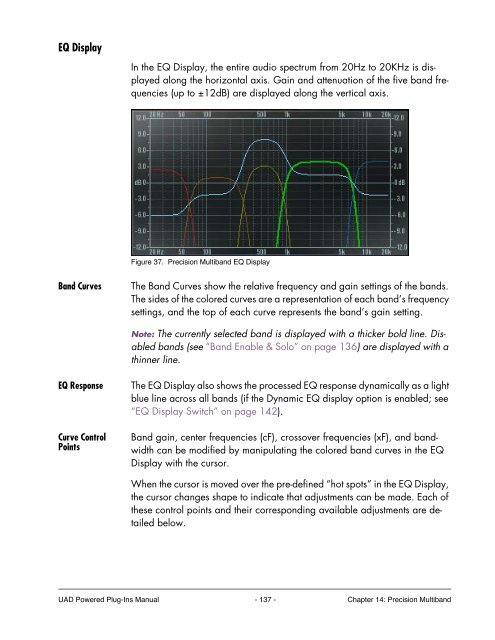
- Page 133 and 134: EQ Display Selection A band can als
- Page 135: COMPRESS When a band is set to Comp
- Page 139 and 140: Frequency Controls Frequency Values
- Page 141 and 142: The band is soloed when its Solo bu
- Page 143 and 144: Power Switch The Power Switch deter
- Page 145 and 146: Precision Limiter Screenshot Figure
- Page 147 and 148: Sliding Meter Scale With the K-Syst
- Page 149 and 150: Meter The Meter switch specifies th
- Page 151 and 152: CHAPTER 16 Precision Buss Compresso
- Page 153 and 154: When Ratio is changed, the Threshol
- Page 155 and 156: Toggling the Fade switch causes an
- Page 157 and 158: CHAPTER 17 Neve 33609 Compressor Ov
- Page 159 and 160: Technical Article The article “As
- Page 161 and 162: Ratio This control determines the c
- Page 163 and 164: In stereo operation the controls fo
- Page 165 and 166: 14dB Typical starting point for mas
- Page 167 and 168: CHAPTER 18 VCA VU Overview The VCA
- Page 169 and 170: Output Gain Output Gain controls th
- Page 171 and 172: Neve 88RS Screenshot Figure 46. The
- Page 173 and 174: Gate/Expander The gate/expander mod
- Page 175 and 176: The available range is -25dB to +15
- Page 177 and 178: An example: When compressing a snar
- Page 179 and 180: Slower release times can smooth the
- Page 181 and 182: HF Freq This parameter determines t
- Page 183 and 184: Cut Enable Cut Frequency This butto
- Page 185 and 186: CHAPTER 20 CS-1 Channel Strip Overv
- Page 187 and 188:
Gain (G) Knob Frequency (fc) Knob B
- Page 189 and 190:
DM-1 Delay Modulator Figure 53. The
- Page 191 and 192:
The RECIR units are expressed as a
- Page 193 and 194:
RS-1 Controls Sync Button Shape Pop
- Page 195 and 196:
CHAPTER 21 Precision Equalizer Over
- Page 197 and 198:
Dual Mode In Dual mode (dual-mono m
- Page 199 and 200:
Frequency Knob The Frequency knob d
- Page 201 and 202:
CHAPTER 22 Cambridge EQ Overview Th
- Page 203 and 204:
Zoom Buttons The vertical scale of
- Page 205 and 206:
Low Cut / High Cut Filters The Low
- Page 207 and 208:
Gain Knob Q (Bandwidth) Knob This p
- Page 209 and 210:
Type III When set to Type III, ther
- Page 211 and 212:
Figure 65. Shelf Type A Figure 66.
- Page 213 and 214:
Pultec Latency The Pultec and Pulte
- Page 215 and 216:
Note: In the documentation supplied
- Page 217 and 218:
In the hardware MEQ-5, the audio is
- Page 219 and 220:
Dip Response Figure 73. Pultec MEQ-
- Page 221 and 222:
CHAPTER 24 Neve 1073 Equalizer Over
- Page 223 and 224:
Note: You can also click the midran
- Page 225 and 226:
Neve 1073SE Controls The Neve 1073S
- Page 227 and 228:
Neve 1081 and 1081SE Controls Overv
- Page 229 and 230:
High-Mid Frequency The high-midrang
- Page 231 and 232:
Cut Filters The independent low and
- Page 233 and 234:
CHAPTER 26 Helios Type 69 Equalizer
- Page 235 and 236:
Bass The Bass knob has a dual purpo
- Page 237 and 238:
Line The Line switch determines whe
- Page 239 and 240:
CHAPTER 27 Harrison 32C EQ Overview
- Page 241 and 242:
Four EQ Bands Low Peak Low Frequenc
- Page 243 and 244:
Harrison 32C Latency The Harrison 3
- Page 245 and 246:
Roland CE-1 Controls The Roland CE-
- Page 247 and 248:
Vibrato Controls These two knobs co
- Page 249 and 250:
Roland Dimension D Controls The Rol
- Page 251 and 252:
Roland RE-201 Screenshot Figure 86.
- Page 253 and 254:
Table 15. RE-201 Mode Selector Posi
- Page 255 and 256:
Note: Echo Volume has no affect whe
- Page 257 and 258:
CHAPTER 31 RealVerb Pro Overview Re
- Page 259 and 260:
The RealVerb Pro user interface is
- Page 261 and 262:
First material Second material Blen
- Page 263 and 264:
tion frequency, the frequency at wh
- Page 265 and 266:
3. Adjust the Band-edge controls fo
- Page 267 and 268:
3. Drag the Decay Time control for
- Page 269 and 270:
Levels The Levels panel lets you ad
- Page 271 and 272:
RealVerb Pro Preset Management Fact
- Page 273 and 274:
Screenshot Figure 97. The DreamVerb
- Page 275 and 276:
Bypass switch Band Amplitude contro
- Page 277 and 278:
Shape Menus DreamVerb lets you spec
- Page 279 and 280:
Materials Menus DreamVerb lets you
- Page 281 and 282:
ER End control bat (time & amplitud
- Page 283 and 284:
Late-Field Start Amplitude & Slope
- Page 285 and 286:
Distance DreamVerb allows you to co
- Page 287 and 288:
Windows On Windows systems, the def
- Page 289 and 290:
• Try different diffusion setting
- Page 291 and 292:
Plate 140 Controls The Plate 140 in
- Page 293 and 294:
Low Frequency Knob This parameter s
- Page 295 and 296:
Hidden Controls Several controls ex
- Page 297 and 298:
CHAPTER 34 Precision Maximizer Over
- Page 299 and 300:
Shape The Shape knob is the primary
- Page 301 and 302:
Output The Output knob controls the
- Page 303 and 304:
Precision Maximizer Latency The Pre
- Page 305 and 306:
Precision De-Esser Controls Control
- Page 307 and 308:
Gain Reduction The Gain Reduction m
- Page 309 and 310:
Precision Enhancer kHz Screenshot F
- Page 311 and 312:
Generally speaking, adjust the Outp
- Page 313 and 314:
SPL Transient Designer Controls Con
- Page 315 and 316:
Acknowledgement In addition to crea
- Page 317 and 318:
Guitars Use the Transient Designer
- Page 319 and 320:
Technology Of course you don‘t ha
- Page 321 and 322:
The SUSTAIN Control Circuitry The S
- Page 323 and 324:
CHAPTER 38 Nigel Introducing Nigel
- Page 325 and 326:
Preflex Plug-in Preflex is the hear
- Page 327 and 328:
Gate Fast Button The Fast control r
- Page 329 and 330:
Amp Module The Preflex Amp is where
- Page 331 and 332:
Pre-EQ Mid Knob Modifies the middle
- Page 333 and 334:
Amp-A Type Menu Amp-B Type Menu Amp
- Page 335 and 336:
Cabinet On/Off Button Output Level
- Page 337 and 338:
LFO Type Menu Determines the LFO (l
- Page 339 and 340:
Sens/Rate/ Wah Knob The function an
- Page 341 and 342:
Wah Pedal Mode Similar to Wah mode,
- Page 343 and 344:
Trem/Fade Module Figure 127. The Tr
- Page 345 and 346:
Tremolo Mode When Tremolo mode is s
- Page 347 and 348:
If the LFO Type menu is set to one
- Page 349 and 350:
Mod Delay LFO Type Table Table 25.
- Page 351 and 352:
Recirculation allows both positive
- Page 353 and 354:
Moog Filter Screenshot Figure 130.
- Page 355 and 356:
Cutoff This parameter defines the c
- Page 357 and 358:
LFO Amount Rate Rate LED LFO Reset
- Page 359 and 360:
Moog Filter SE Overview The UAD Moo
- Page 361 and 362:
CHAPTER 40 Little Labs IBP Overview
- Page 363 and 364:
Phase Adjust 90°/180° This switch
- Page 365 and 366:
Universal Audio. It wasn't long bef
- Page 367 and 368:
well as Sinatra's "It Was A Very Go
- Page 369 and 370:
The basic concept of a compressor/l
- Page 371 and 372:
Pros Talk UA Both the 1176 and the
- Page 373 and 374:
Jim Scott Jim Scott shared a Grammy
- Page 375 and 376:
Thank You We would like to thank yo
- Page 377 and 378:
INDEX Cambridge EQ Controls 202 Cam
- Page 379 and 380:
INDEX Helios 69 Latency 237 Helios
- Page 381 and 382:
INDEX Nigel 212, 323, 324 Nigel Mod
- Page 383 and 384:
INDEX Sens 339 Sens/Rate/Wah Knob 3
- Page 385:
INDEX UAD Powered Plug-Ins Manual -


![203280_d_man.pdf [23,41 MB] - Just Music](https://img.yumpu.com/23736901/1/184x260/203280-d-manpdf-2341-mb-just-music.jpg?quality=85)


![244712_d_man.pdf [266,60 kB] - Just Music](https://img.yumpu.com/23736779/1/190x133/244712-d-manpdf-26660-kb-just-music.jpg?quality=85)