The significance of coherent flow structures for the turbulent mixing ...
The significance of coherent flow structures for the turbulent mixing ...
The significance of coherent flow structures for the turbulent mixing ...
Create successful ePaper yourself
Turn your PDF publications into a flip-book with our unique Google optimized e-Paper software.
ß<br />
<br />
<br />
ß<br />
6.2 Statistical properties <strong>of</strong> <strong>the</strong> buffer layer<br />
6.2 Statistical properties <strong>of</strong> <strong>the</strong> buffer layer<br />
6.2.1 Single point statistics<br />
It has already been stated that <strong>the</strong> lower right graph <strong>of</strong> figure 6.1 implies that <strong>the</strong> dominant<br />
physical processes, which are responsible <strong>for</strong> <strong>the</strong> <strong>turbulent</strong> <strong>mixing</strong> in near-wall turbulence,<br />
change when approaching <strong>the</strong> wall. This becomes even more evident when <strong>the</strong> joint probabil-<br />
is considered. This can be clearly<br />
ity density function <strong>of</strong> <strong>the</strong> 697 velocity 69t<br />
fluctuations<br />
þ¥<br />
and<br />
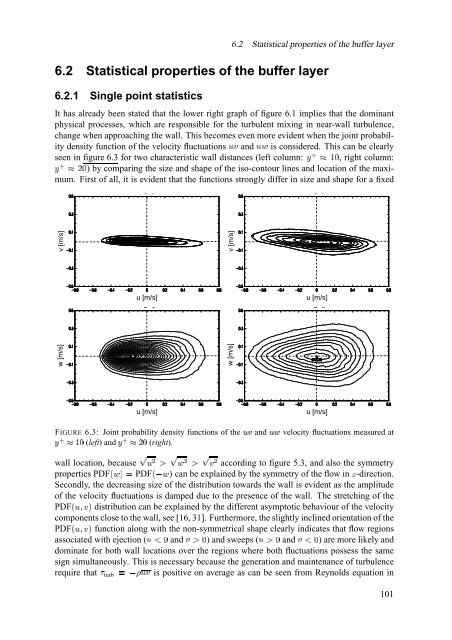
seen in figure 6.3 <strong>for</strong> two characteristic wall distances u.v ;<br />
(left column: , right column:<br />
Ó ) by comparing <strong>the</strong> size and shape <strong>of</strong> <strong>the</strong> iso-contour lines and location <strong>of</strong> <strong>the</strong> maximum.<br />
First <strong>of</strong> all, it is evident that <strong>the</strong> functions strongly differ in size and shape <strong>for</strong> a<br />
u.v ;<br />
fixed<br />
v [m/s]<br />
v [m/s]<br />
u [m/s]<br />
u [m/s]<br />
w [m/s]<br />
w [m/s]<br />
u [m/s]<br />
FIGURE 6.3: Joint probability density functions <strong>of</strong> /.0 <strong>the</strong> /3 and<br />
(right).<br />
(left) and Üvxwzy<br />
u [m/s]<br />
velocity fluctuations measured at<br />
Üvxw ÷<br />
wall location, K 6 ' £ K t ' £ K 7 ' because according to figure 5.3, and also <strong>the</strong> symmetry<br />
PDF{|t~} W PDF{Ît~} properties can be explained by <strong>the</strong> symmetry <strong>of</strong> <strong>the</strong> <strong>flow</strong> X in -direction.<br />
Secondly, <strong>the</strong> decreasing size <strong>of</strong> <strong>the</strong> distribution towards <strong>the</strong> wall is evident as <strong>the</strong> amplitude<br />
<strong>of</strong> <strong>the</strong> velocity fluctuations is damped due to <strong>the</strong> presence <strong>of</strong> <strong>the</strong> wall. <strong>The</strong> stretching <strong>of</strong> <strong>the</strong><br />
7.} distribution can be explained by <strong>the</strong> different asymptotic behaviour <strong>of</strong> <strong>the</strong> velocity<br />
PDF{6<br />
components close to <strong>the</strong> wall, see [16, 31]. Fur<strong>the</strong>rmore, <strong>the</strong> slightly inclined orientation <strong>of</strong> <strong>the</strong><br />
function along with <strong>the</strong> non-symmetrical shape clearly indicates that <strong>flow</strong> regions<br />
7.}<br />
PDF{6<br />
(6N€ 7 (6 £ € 7 £<br />
W V Î& 6(7<br />
associated with ejection and ) and sweeps and ) are more likely and<br />
dominate <strong>for</strong> both wall locations over <strong>the</strong> regions where both fluctuations possess <strong>the</strong> same<br />
sign simultaneously. This is necessary because <strong>the</strong> generation and maintenance <strong>of</strong> turbulence<br />
require that turb is positive on average as can be seen from Reynolds equation in<br />
101


