The significance of coherent flow structures for the turbulent mixing ...
The significance of coherent flow structures for the turbulent mixing ...
The significance of coherent flow structures for the turbulent mixing ...
Create successful ePaper yourself
Turn your PDF publications into a flip-book with our unique Google optimized e-Paper software.
¾<br />
¾<br />
5.3.2 Spatial auto- and cross-correlation functions<br />
5.3 Statistical properties <strong>of</strong> <strong>the</strong> <strong>flow</strong><br />
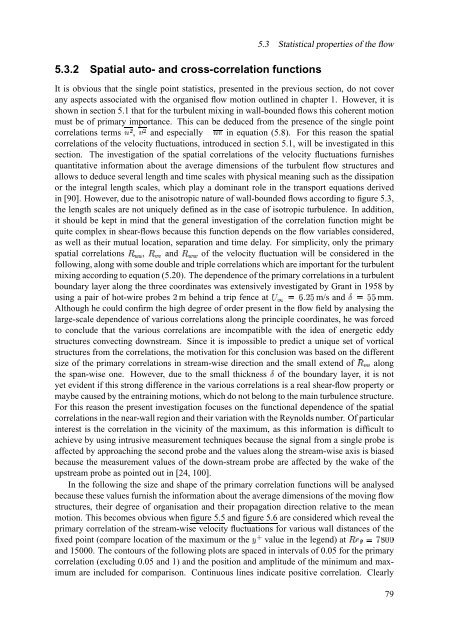
It is obvious that <strong>the</strong> single point statistics, presented in <strong>the</strong> previous section, do not cover<br />
any aspects associated with <strong>the</strong> organised <strong>flow</strong> motion outlined in chapter 1. However, it is<br />
shown in section 5.1 that <strong>for</strong> <strong>the</strong> <strong>turbulent</strong> <strong>mixing</strong> in wall-bounded <strong>flow</strong>s this <strong>coherent</strong> motion<br />
must be <strong>of</strong> primary importance. This can be deduced from <strong>the</strong> presence <strong>of</strong> <strong>the</strong> single point<br />
correlations terms · ¬ , ³ ¬ and especially Î · ³ in equation (5.8). For this reason <strong>the</strong> spatial<br />
correlations <strong>of</strong> <strong>the</strong> velocity fluctuations, introduced in section 5.1, will be investigated in this<br />
section. <strong>The</strong> investigation <strong>of</strong> <strong>the</strong> spatial correlations <strong>of</strong> <strong>the</strong> velocity fluctuations furnishes<br />
quantitative in<strong>for</strong>mation about <strong>the</strong> average dimensions <strong>of</strong> <strong>the</strong> <strong>turbulent</strong> <strong>flow</strong> <strong>structures</strong> and<br />
allows to deduce several length and time scales with physical meaning such as <strong>the</strong> dissipation<br />
or <strong>the</strong> integral length scales, which play a dominant role in <strong>the</strong> transport equations derived<br />
in [90]. However, due to <strong>the</strong> anisotropic nature <strong>of</strong> wall-bounded <strong>flow</strong>s according to figure 5.3,<br />
<strong>the</strong> length scales are not uniquely defined as in <strong>the</strong> case <strong>of</strong> isotropic turbulence. In addition,<br />
it should be kept in mind that <strong>the</strong> general investigation <strong>of</strong> <strong>the</strong> correlation function might be<br />
quite complex in shear-<strong>flow</strong>s because this function depends on <strong>the</strong> <strong>flow</strong> variables considered,<br />
as well as <strong>the</strong>ir mutual location, separation and time delay. For simplicity, only <strong>the</strong> primary<br />
spatial correlations ¼ÐÏ'Ï , ¼ÐÑÑ and ¼ÐÒHÒ <strong>of</strong> <strong>the</strong> velocity fluctuation will be considered in <strong>the</strong><br />
following, along with some double and triple correlations which are important <strong>for</strong> <strong>the</strong> <strong>turbulent</strong><br />
<strong>mixing</strong> according to equation (5.20). <strong>The</strong> dependence <strong>of</strong> <strong>the</strong> primary correlations in a <strong>turbulent</strong><br />
boundary layer along <strong>the</strong> three coordinates was extensively investigated by Grant in 1958 by<br />
mm. ”Œ”<br />
using a pair <strong>of</strong> hot-wire Ó probes m behind a trip fence »Ô Á4‘ÕÓz” at m/s Ö and<br />
Although he could confirm <strong>the</strong> high degree <strong>of</strong> order present in <strong>the</strong> <strong>flow</strong> field by analysing <strong>the</strong><br />
large-scale dependence <strong>of</strong> various correlations along <strong>the</strong> principle coordinates, he was <strong>for</strong>ced<br />
to conclude that <strong>the</strong> various correlations are incompatible with <strong>the</strong> idea <strong>of</strong> energetic eddy<br />
<strong>structures</strong> convecting downstream. Since it is impossible to predict a unique set <strong>of</strong> vortical<br />
<strong>structures</strong> from <strong>the</strong> correlations, <strong>the</strong> motivation <strong>for</strong> this conclusion was based on <strong>the</strong> different<br />
size <strong>of</strong> <strong>the</strong> primary correlations in stream-wise direction and <strong>the</strong> small extend ¼ÐÑÑ <strong>of</strong> along<br />
<strong>the</strong> span-wise one. However, due to <strong>the</strong> small Ö thickness <strong>of</strong> <strong>the</strong> boundary layer, it is not<br />
yet evident if this strong difference in <strong>the</strong> various correlations is a real shear-<strong>flow</strong> property or<br />
maybe caused by <strong>the</strong> entraining motions, which do not belong to <strong>the</strong> main turbulence structure.<br />
For this reason <strong>the</strong> present investigation focuses on <strong>the</strong> functional dependence <strong>of</strong> <strong>the</strong> spatial<br />
correlations in <strong>the</strong> near-wall region and <strong>the</strong>ir variation with <strong>the</strong> Reynolds number. Of particular<br />
interest is <strong>the</strong> correlation in <strong>the</strong> vicinity <strong>of</strong> <strong>the</strong> maximum, as this in<strong>for</strong>mation is difficult to<br />
achieve by using intrusive measurement techniques because <strong>the</strong> signal from a single probe is<br />
affected by approaching <strong>the</strong> second probe and <strong>the</strong> values along <strong>the</strong> stream-wise axis is biased<br />
because <strong>the</strong> measurement values <strong>of</strong> <strong>the</strong> down-stream probe are affected by <strong>the</strong> wake <strong>of</strong> <strong>the</strong><br />
upstream probe as pointed out in [24, 100].<br />
In <strong>the</strong> following <strong>the</strong> size and shape <strong>of</strong> <strong>the</strong> primary correlation functions will be analysed<br />
because <strong>the</strong>se values furnish <strong>the</strong> in<strong>for</strong>mation about <strong>the</strong> average dimensions <strong>of</strong> <strong>the</strong> moving <strong>flow</strong><br />
<strong>structures</strong>, <strong>the</strong>ir degree <strong>of</strong> organisation and <strong>the</strong>ir propagation direction relative to <strong>the</strong> mean<br />
motion. This becomes obvious when figure 5.5 and figure 5.6 are considered which reveal <strong>the</strong><br />
primary correlation <strong>of</strong> <strong>the</strong> stream-wise velocity fluctuations <strong>for</strong> various wall distances <strong>of</strong> <strong>the</strong><br />
fixed point (compare location <strong>of</strong> <strong>the</strong> maximum or ÄHÅ <strong>the</strong> value in <strong>the</strong> legend) ¼× ÂŒz<br />
at<br />
and 15000. <strong>The</strong> contours <strong>of</strong> <strong>the</strong> following plots are spaced in intervals <strong>of</strong> 0.05 <strong>for</strong> <strong>the</strong> primary<br />
correlation (excluding 0.05 and 1) and <strong>the</strong> position and amplitude <strong>of</strong> <strong>the</strong> minimum and maximum<br />
are included <strong>for</strong> comparison. Continuous lines indicate positive correlation. Clearly<br />
½V¾}À<br />
79


