

The significance of coherent flow structures for the turbulent mixing ...
The significance of coherent flow structures for the turbulent mixing ...
The significance of coherent flow structures for the turbulent mixing ...

You also want an ePaper? Increase the reach of your titles
YUMPU automatically turns print PDFs into web optimized ePapers that Google loves.
‘<br />
—<br />
s<br />
7.2 Statistical properties <strong>of</strong> <strong>the</strong> log-law region<br />
25<br />
30<br />
U + mean<br />
20<br />
15<br />
10<br />
5<br />
’<br />
yz−result<br />
“<br />
xy−result<br />
U + mean<br />
25<br />
20<br />
15<br />
10<br />
5<br />
0<br />
3<br />
Ž<br />
0<br />
100<br />
Ž<br />
200<br />
Ž<br />
y +<br />
300<br />
Ž<br />
400<br />
Ž<br />
500<br />
Ž<br />
0<br />
a.u.<br />
Ž Ž<br />
1 10 100<br />
y +<br />
1000<br />
Ž<br />
v + rms<br />
w + rms<br />
u + rms<br />
2<br />
1<br />
PDF (u + )<br />
PDF (v + )<br />
PDF (w + )<br />
a.u.<br />
Ž Ž<br />
1 10 100<br />
y +<br />
PDF(uv)<br />
PDF(vw)<br />
PDF(uw)<br />
1000<br />
Ž<br />
a.u.<br />
” −7.5 • −5.0 – −2.5 0.0 2.5 5.0 7.5<br />
u i<br />
+<br />
PDF (ω x<br />
)<br />
Ž −1 0<br />
1<br />
u i<br />
u j<br />
Ž Ž<br />
−300 −200 −100 0 100<br />
ω x<br />
[1/s]<br />
200<br />
Ž<br />
300<br />
Ž<br />
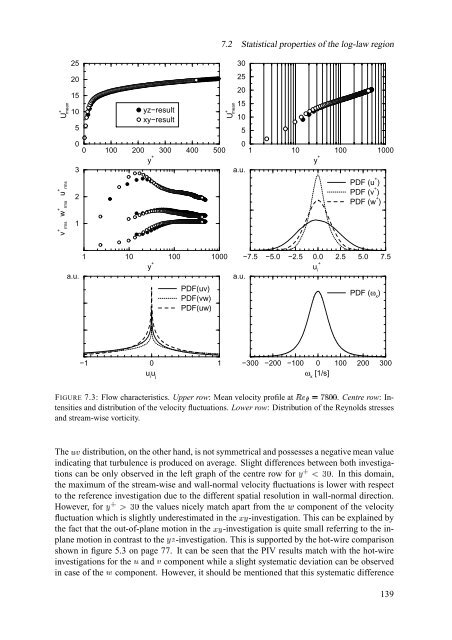
FIGURE 7.3: Flow characteristics. Upper row: Mean velocity pr<strong>of</strong>ile at ˜$v›šLœ§§žž . Centre row: Intensities<br />
and distribution <strong>of</strong> <strong>the</strong> velocity fluctuations. Lower row: Distribution <strong>of</strong> <strong>the</strong> Reynolds stresses<br />
and stream-wise vorticity.<br />
<strong>The</strong> distribution, on <strong>the</strong> o<strong>the</strong>r hand, is not symmetrical and possesses a negative mean value<br />
indicating that turbulence is produced on average. Slight differences between both investigations<br />
can be only observed in <strong>the</strong> left graph <strong>of</strong> <strong>the</strong> centre row <strong>for</strong> |ŸŒ o2h . In this domain,<br />
q<br />
<strong>the</strong> maximum <strong>of</strong> <strong>the</strong> stream-wise and wall-normal velocity fluctuations is lower with respect<br />
to <strong>the</strong> reference investigation due to <strong>the</strong> different spatial resolution in wall-normal direction.<br />
However, q hc <strong>for</strong> <strong>the</strong> values nicely match apart from <strong>the</strong> component <strong>of</strong> <strong>the</strong> velocity<br />
s¢¡<br />
fluctuation which is slightly underestimated in Οq <strong>the</strong> -investigation. This can be explained by<br />
<strong>the</strong> fact that <strong>the</strong> out-<strong>of</strong>-plane motion in Οq <strong>the</strong> -investigation is quite small referring to <strong>the</strong> inplane<br />
motion in contrast to qÏ <strong>the</strong> -investigation. This is supported by <strong>the</strong> hot-wire comparison<br />
shown in figure 5.3 on page 77. It can be seen that <strong>the</strong> PIV results match with <strong>the</strong> hot-wire<br />
investigations <strong>for</strong> <strong>the</strong> and component while a slight systematic deviation can be observed<br />
in case <strong>of</strong> <strong>the</strong> component. However, it should be mentioned that this systematic difference<br />
Π|<br />
139


