

The significance of coherent flow structures for the turbulent mixing ...
The significance of coherent flow structures for the turbulent mixing ...
The significance of coherent flow structures for the turbulent mixing ...

Create successful ePaper yourself
Turn your PDF publications into a flip-book with our unique Google optimized e-Paper software.
—<br />
6 Investigation <strong>of</strong> <strong>the</strong> xz-plane<br />
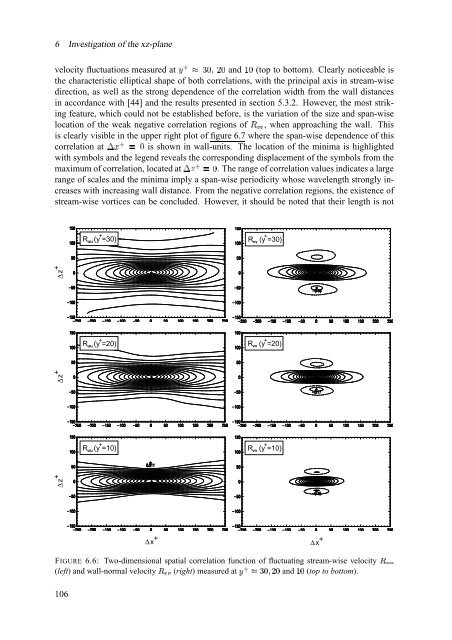
velocity fluctuations measured at «¢ÀÁ À and ª¡À (top to bottom). Clearly noticeable is<br />
<strong>the</strong> characteristic elliptical shape <strong>of</strong> both correlations, with <strong>the</strong> principal axis in stream-wise<br />
direction, as well as <strong>the</strong> strong dependence <strong>of</strong> <strong>the</strong> correlation width from <strong>the</strong> wall distances<br />
.®zÊ<br />
in accordance with [44] and <strong>the</strong> results presented in section 5.3.2. However, <strong>the</strong> most striking<br />
feature, which could not be established be<strong>for</strong>e, is <strong>the</strong> variation <strong>of</strong> <strong>the</strong> size and span-wise<br />
location <strong>of</strong> <strong>the</strong> weak negative correlation regions ÃËÌË <strong>of</strong> , when approaching <strong>the</strong> wall. This<br />
is clearly visible in <strong>the</strong> upper right plot <strong>of</strong> figure 6.7 where <strong>the</strong> span-wise dependence <strong>of</strong> this<br />
correlation Í5Î ® ¿ À at is shown in wall-units. <strong>The</strong> location <strong>of</strong> <strong>the</strong> minima is highlighted<br />
with symbols and <strong>the</strong> legend reveals <strong>the</strong> corresponding displacement <strong>of</strong> <strong>the</strong> symbols from <strong>the</strong><br />
maximum <strong>of</strong> correlation, located ÍeÏ ® ¿ À at . <strong>The</strong> range <strong>of</strong> correlation values indicates a large<br />
range <strong>of</strong> scales and <strong>the</strong> minima imply a span-wise periodicity whose wavelength strongly increases<br />
with increasing wall distance. From <strong>the</strong> negative correlation regions, <strong>the</strong> existence <strong>of</strong><br />
stream-wise vortices can be concluded. However, it should be noted that <strong>the</strong>ir length is not<br />
+ +<br />
R uu (y =30)<br />
R (y =30)<br />
vv<br />
∆ z +<br />
∆ z +<br />
∆ z<br />
+<br />
+<br />
R uu (y =20)<br />
+<br />
R uu (y =10)<br />
+<br />
R vv (y =20)<br />
+<br />
R vv (y =10)<br />
∆x + ∆x +<br />
FIGURE 6.6: Two-dimensional spatial correlation function <strong>of</strong> fluctuating stream-wise ÐÒÑ˜Ñ velocity<br />
(left) and wall-normal Ð ËÌË velocity (right) measured Ó ®ÕÔ×֥آÙÛÚ¥Ø<br />
at Ü Ø<br />
and (top to bottom).<br />
106


