

The significance of coherent flow structures for the turbulent mixing ...
The significance of coherent flow structures for the turbulent mixing ...
The significance of coherent flow structures for the turbulent mixing ...

Create successful ePaper yourself
Turn your PDF publications into a flip-book with our unique Google optimized e-Paper software.
ô<br />
ô<br />
7.3 Spatio-temporal correlations with ×_ñò¬\<br />
ô<br />
ô<br />
š<br />
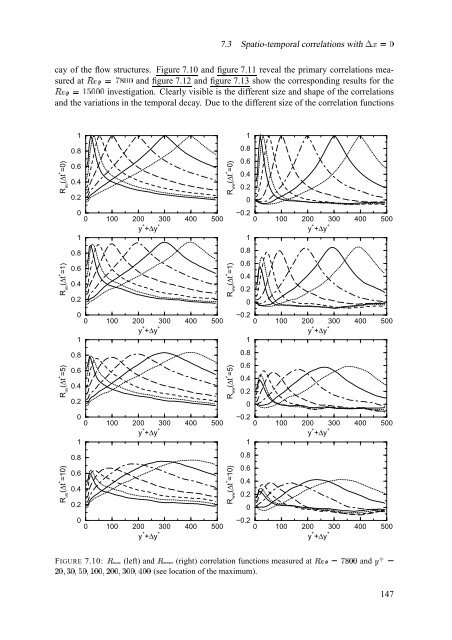
cay <strong>of</strong> <strong>the</strong> <strong>flow</strong> <strong>structures</strong>. Figure 7.10 and figure 7.11 reveal <strong>the</strong> primary correlations measured<br />
ª«§p¬3®c¯c at and figure 7.12 and figure 7.13 show <strong>the</strong> corresponding results <strong>for</strong> <strong>the</strong><br />
¿ ° investigation. Clearly visible is <strong>the</strong> different size and shape <strong>of</strong> <strong>the</strong> correlations<br />
ª«§¬<br />
and <strong>the</strong> variations in <strong>the</strong> temporal decay. Due to <strong>the</strong> different size <strong>of</strong> <strong>the</strong> correlation functions<br />
1<br />
1<br />
R uu<br />
(∆t + =0)<br />
0.8<br />
0.6<br />
0.4<br />
0.2<br />
R ww<br />
(∆t + =0)<br />
0.8<br />
0.6<br />
0.4<br />
0.2<br />
0<br />
0<br />
1<br />
ô<br />
0<br />
100<br />
ô<br />
200<br />
ô<br />
y + +∆y +<br />
300<br />
ô<br />
400<br />
ô<br />
500<br />
ô<br />
−0.2<br />
1<br />
ô<br />
0<br />
100<br />
ô<br />
200<br />
ô<br />
y + +∆y +<br />
300<br />
ô<br />
400<br />
ô<br />
500<br />
ô<br />
R uu<br />
(∆t + =1)<br />
0.8<br />
0.6<br />
0.4<br />
0.2<br />
R ww<br />
(∆t + =1)<br />
0.8<br />
0.6<br />
0.4<br />
0.2<br />
0<br />
0<br />
1<br />
ô<br />
0<br />
100<br />
ô<br />
ô<br />
200 300<br />
y + +∆y + õ<br />
400<br />
ô<br />
500<br />
ô<br />
−0.2<br />
1<br />
ô<br />
0<br />
100<br />
ô<br />
ô<br />
200 300<br />
y + +∆y + õ<br />
400<br />
ô<br />
500<br />
ô<br />
R uu<br />
(∆t + =5)<br />
0.8<br />
0.6<br />
0.4<br />
0.2<br />
R ww<br />
(∆t + =5)<br />
0.8<br />
0.6<br />
0.4<br />
0.2<br />
0<br />
0<br />
1<br />
ô<br />
0<br />
100<br />
ô<br />
ô<br />
200 300<br />
y + +∆y + õ<br />
400<br />
ô<br />
500<br />
ô<br />
−0.2<br />
1<br />
ô<br />
0<br />
100<br />
ô<br />
ô<br />
200 300<br />
y + +∆y + õ<br />
400<br />
ô<br />
500<br />
ô<br />
R uu<br />
(∆t + =10)<br />
0.8<br />
0.6<br />
0.4<br />
0.2<br />
R ww<br />
(∆t + =10)<br />
0.8<br />
0.6<br />
0.4<br />
0.2<br />
0<br />
0<br />
ó<br />
0<br />
100<br />
ó<br />
200<br />
ó<br />
y + +∆y +<br />
300<br />
ó<br />
400<br />
ó<br />
500<br />
ó<br />
−0.2<br />
ó<br />
0<br />
100<br />
ó<br />
200<br />
ó<br />
y + +∆y +<br />
300<br />
ó<br />
400<br />
ó<br />
500<br />
ó<br />
147<br />
FIGURE ˜ ·$· 7.10: (left) ˜ Ù&Ù and (right) correlation functions measured ˜šuœ§§žž at © » and<br />
ž Æ Î§ž ÆËÏ ž ÆÐ žž ÆËÑ ž±ž Æ Îžž ÆÓÒ žž (see location <strong>of</strong> <strong>the</strong> maximum).<br />
Ñ


