The significance of coherent flow structures for the turbulent mixing ...
The significance of coherent flow structures for the turbulent mixing ...
The significance of coherent flow structures for the turbulent mixing ...
You also want an ePaper? Increase the reach of your titles
YUMPU automatically turns print PDFs into web optimized ePapers that Google loves.
or<br />
= ö<br />
D<br />
Q<br />
ù<br />
ù ?xö<br />
ù Y[Z]\<br />
&<br />
&<br />
<br />
R R<br />
XEãU<br />
G<br />
R<br />
Q<br />
&<br />
<br />
R<br />
U<br />
ì<br />
=<br />
ñR SR<br />
HKMWU<br />
2.4 Particle image analysis<br />
FE3@<br />
IHKJLHKM G<br />
(2.7)<br />
(2.8)<br />
öNPO<br />
R<br />
HKJVU<br />
SR<br />
KT<br />
(2.9)<br />
?@<br />
ù Q<br />
FE<br />
(2.10)<br />
?CB<br />
Q <br />
^<br />
_a`<br />
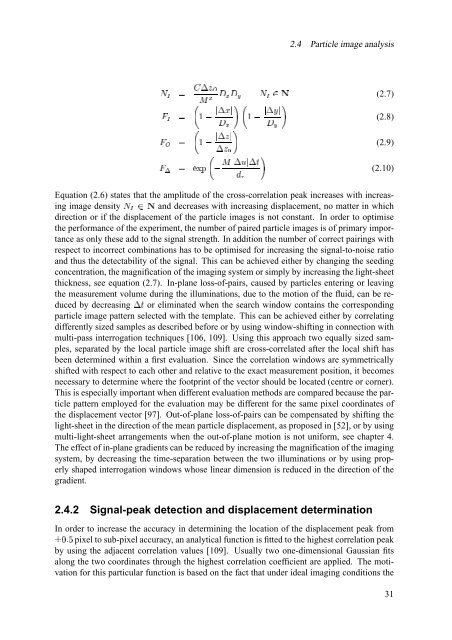
Equation (2.6) states that <strong>the</strong> amplitude <strong>of</strong> <strong>the</strong> cross-correlation peak increases with increasing<br />
image density and decreases with increasing displacement, no matter in which<br />
direction or if <strong>the</strong> displacement <strong>of</strong> <strong>the</strong> particle images is not constant. In order to optimise<br />
öWNO<br />
<strong>the</strong> per<strong>for</strong>mance <strong>of</strong> <strong>the</strong> experiment, <strong>the</strong> number <strong>of</strong> paired particle images is <strong>of</strong> primary = importance<br />
as only <strong>the</strong>se add to <strong>the</strong> signal strength. In addition <strong>the</strong> number <strong>of</strong> correct pairings with<br />
respect to incorrect combinations has to be optimised <strong>for</strong> increasing <strong>the</strong> signal-to-noise ratio<br />
and thus <strong>the</strong> detectability <strong>of</strong> <strong>the</strong> signal. This can be achieved ei<strong>the</strong>r by changing <strong>the</strong> seeding<br />
concentration, <strong>the</strong> magnification <strong>of</strong> <strong>the</strong> imaging system or simply by increasing <strong>the</strong> light-sheet<br />
thickness, see equation (2.7). In-plane loss-<strong>of</strong>-pairs, caused by particles entering or leaving<br />
<strong>the</strong> measurement volume during <strong>the</strong> illuminations, due to <strong>the</strong> motion <strong>of</strong> <strong>the</strong> fluid, can be reduced<br />
by decreasing eliminated when <strong>the</strong> search window contains <strong>the</strong> corresponding<br />
particle image pattern selected with <strong>the</strong> template. This can be achieved ei<strong>the</strong>r by correlating<br />
differently sized samples as described be<strong>for</strong>e or by using window-shifting in connection with<br />
<br />
multi-pass interrogation techniques [106, 109]. Using this approach two equally sized samples,<br />
separated by <strong>the</strong> local particle image shift are cross-correlated after <strong>the</strong> local shift has<br />
been determined within a first evaluation. Since <strong>the</strong> correlation windows are symmetrically<br />
ì<br />
shifted with respect to each o<strong>the</strong>r and relative to <strong>the</strong> exact measurement position, it becomes<br />
necessary to determine where <strong>the</strong> footprint <strong>of</strong> <strong>the</strong> vector should be located (centre or corner).<br />
This is especially important when different evaluation methods are compared because <strong>the</strong> particle<br />
pattern employed <strong>for</strong> <strong>the</strong> evaluation may be different <strong>for</strong> <strong>the</strong> same pixel coordinates <strong>of</strong><br />
<strong>the</strong> displacement vector [97]. Out-<strong>of</strong>-plane loss-<strong>of</strong>-pairs can be compensated by shifting <strong>the</strong><br />
light-sheet in <strong>the</strong> direction <strong>of</strong> <strong>the</strong> mean particle displacement, as proposed in [52], or by using<br />
multi-light-sheet arrangements when <strong>the</strong> out-<strong>of</strong>-plane motion is not uni<strong>for</strong>m, see chapter 4.<br />
<strong>The</strong> effect <strong>of</strong> in-plane gradients can be reduced by increasing <strong>the</strong> magnification <strong>of</strong> <strong>the</strong> imaging<br />
system, by decreasing <strong>the</strong> time-separation between <strong>the</strong> two illuminations or by using properly<br />
shaped interrogation windows whose linear dimension is reduced in <strong>the</strong> direction <strong>of</strong> <strong>the</strong><br />
gradient.<br />
2.4.2 Signal-peak detection and displacement determination<br />
In order to increase <strong>the</strong> accuracy in determining <strong>the</strong> location <strong>of</strong> <strong>the</strong> displacement peak from<br />
pixel to sub-pixel accuracy, an analytical function is fitted to <strong>the</strong> highest correlation peak<br />
#dce<br />
by using <strong>the</strong> adjacent correlation values [109]. Usually two one-dimensional Gaussian fits<br />
along <strong>the</strong> two coordinates through <strong>the</strong> highest correlation coefficient are applied. <strong>The</strong> motivation<br />
<strong>for</strong> this particular function is based on <strong>the</strong> fact that under ideal imaging conditions <strong>the</strong><br />
31


