

The significance of coherent flow structures for the turbulent mixing ...
The significance of coherent flow structures for the turbulent mixing ...
The significance of coherent flow structures for the turbulent mixing ...

You also want an ePaper? Increase the reach of your titles
YUMPU automatically turns print PDFs into web optimized ePapers that Google loves.
§<br />
¦<br />
¥<br />
£<br />
£<br />
§<br />
¦<br />
¥<br />
£<br />
£<br />
7 Investigation <strong>of</strong> <strong>the</strong> yz-plane<br />
1<br />
1<br />
0.8<br />
0.8<br />
0.6<br />
0.6<br />
R uu<br />
0.4<br />
R uu<br />
0.4<br />
0.2<br />
0.2<br />
0<br />
1<br />
£<br />
0<br />
100<br />
£<br />
£<br />
200 300<br />
y + +∆y + ¤<br />
400<br />
£<br />
500<br />
£<br />
0<br />
1<br />
£<br />
0<br />
200<br />
£<br />
£<br />
400 600<br />
y + +∆y + ¤<br />
800<br />
£<br />
1000<br />
£<br />
0.8<br />
0.8<br />
0.6<br />
0.6<br />
R vv<br />
0.4<br />
R vv<br />
0.4<br />
0.2<br />
0.2<br />
0<br />
1<br />
£<br />
0<br />
100<br />
£<br />
200<br />
£<br />
y + +∆y +<br />
300<br />
£<br />
400<br />
£<br />
500<br />
£<br />
0<br />
1<br />
£<br />
0<br />
200<br />
£<br />
400<br />
£<br />
y + +∆y +<br />
600<br />
£<br />
800<br />
£<br />
1000<br />
£<br />
0.8<br />
0.8<br />
0.6<br />
0.6<br />
R ww<br />
0.4<br />
0.2<br />
R ww<br />
0.4<br />
0.2<br />
0<br />
0<br />
−0.2<br />
£<br />
0<br />
100<br />
£<br />
£<br />
200 300<br />
y + +∆y + ¤<br />
400<br />
£<br />
500<br />
£<br />
−0.2<br />
£<br />
0<br />
200<br />
£<br />
£<br />
400 600<br />
y + +∆y + ¤<br />
800<br />
£<br />
1000<br />
£<br />
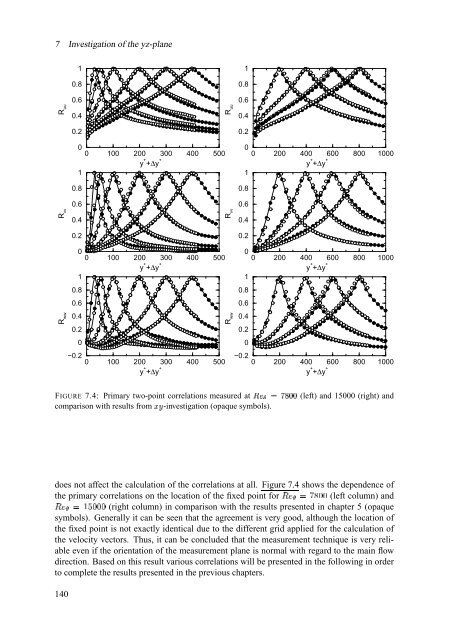
FIGURE 7.4: Primary two-point correlations measured at ˜$vpš5œ§§žž (left) and 15000 (right) and<br />
comparison with results from ¨&© -investigation (opaque symbols).<br />
does not affect <strong>the</strong> calculation <strong>of</strong> <strong>the</strong> correlations at all. Figure 7.4 shows <strong>the</strong> dependence <strong>of</strong><br />
<strong>the</strong> primary correlations on <strong>the</strong> location <strong>of</strong> <strong>the</strong> fixed point ª«§v¬2®c¯ <strong>for</strong> (left column) and<br />
k±° c (right column) in comparison with <strong>the</strong> results presented in chapter 5 (opaque<br />
ª«§vj¬<br />
symbols). Generally it can be seen that <strong>the</strong> agreement is very good, although <strong>the</strong> location <strong>of</strong><br />
<strong>the</strong> fixed point is not exactly identical due to <strong>the</strong> different grid applied <strong>for</strong> <strong>the</strong> calculation <strong>of</strong><br />
<strong>the</strong> velocity vectors. Thus, it can be concluded that <strong>the</strong> measurement technique is very reliable<br />
even if <strong>the</strong> orientation <strong>of</strong> <strong>the</strong> measurement plane is normal with regard to <strong>the</strong> main <strong>flow</strong><br />
direction. Based on this result various correlations will be presented in <strong>the</strong> following in order<br />
to complete <strong>the</strong> results presented in <strong>the</strong> previous chapters.<br />
140


