

The significance of coherent flow structures for the turbulent mixing ...
The significance of coherent flow structures for the turbulent mixing ...
The significance of coherent flow structures for the turbulent mixing ...

You also want an ePaper? Increase the reach of your titles
YUMPU automatically turns print PDFs into web optimized ePapers that Google loves.
6 Investigation <strong>of</strong> <strong>the</strong> xz-plane<br />
<strong>The</strong> left plot <strong>of</strong> <strong>the</strong> centre row <strong>of</strong> figure 6.7 reveals Äê Ñ¡ë3ìÌí ê Ñ¡ë3ìÌí <strong>the</strong> correlations, denoted by<br />
êïî Ñí êïî Ñí <strong>for</strong> simplicity, and <strong>the</strong> right plot shows <strong>the</strong> associated correlation <strong>of</strong> <strong>the</strong> positive and<br />
Ã<br />
negative wall-normal fluctuations in <strong>the</strong> particular regions § where is negative. <strong>The</strong> <strong>coherent</strong><br />
velocity regions selected in this way show nearly <strong>the</strong> same functional dependence around <strong>the</strong><br />
maximum (down to correlation values <strong>of</strong> 0.2 à êïî Ñí êïî Ñí <strong>for</strong> and nearly zero ÃËÛË ¹ §zºðÀ¼ <strong>for</strong> ),<br />
which indicates a high degree <strong>of</strong> coherence in wall-normal direction. When ÃËÌË ¹ §-ºñÀ¼<br />
<strong>the</strong><br />
correlation is considered <strong>the</strong> value <strong>of</strong> <strong>the</strong> minimum increases with increasing wall distance.<br />
This is completely different when only <strong>the</strong> correlations <strong>of</strong> <strong>the</strong> wall-normal fluctuations are<br />
calculated which can be measured in regions where <strong>the</strong> stream-wise velocity fluctuations are<br />
larger than <strong>the</strong> mean velocity, ÃËÛË ¹ §-½ðÀ¼ e.g. as shown in <strong>the</strong> lower right plot <strong>of</strong> <strong>the</strong> same<br />
figure. In this case <strong>the</strong> value <strong>of</strong> <strong>the</strong> minimum decreases with increasing wall distance. <strong>The</strong><br />
symbol explanation <strong>of</strong> ÃËÛË ¹ §òºóÀ¼ <strong>the</strong> ÃËÌË ¹ §ô½¤À¼ and correlations in <strong>the</strong> figures indicates that<br />
<strong>the</strong> distance between <strong>the</strong> minima and <strong>the</strong> maximum increases with increasing wall distance <strong>for</strong><br />
both functions but faster <strong>for</strong> ÃËÛË ¹ §j½õÀ¼ <strong>the</strong> , especially close to <strong>the</strong> wall. Moreover, it can be<br />
concluded from <strong>the</strong> functional dependence <strong>of</strong> <strong>the</strong> correlations around <strong>the</strong> maximum that <strong>the</strong><br />
coherence <strong>of</strong> ÃËÛË ¹ §F½öÀ¼ <strong>the</strong> <strong>structures</strong> is ra<strong>the</strong>r weak compared to <strong>the</strong> <strong>coherent</strong> <strong>structures</strong><br />
represented ÃËÌË ¹ §óº÷À¢¼ by . Also, <strong>the</strong> <strong>structures</strong> which enter in <strong>the</strong> calculation à êïî Ñí êïî Ñí <strong>of</strong><br />
loose <strong>the</strong>ir identity to a large extent with increasing wall-distance as indicated by <strong>the</strong> strong<br />
difference between <strong>the</strong> graphs. <strong>The</strong> exact value <strong>of</strong> <strong>the</strong> span-wise periodicity <strong>of</strong> <strong>the</strong> <strong>structures</strong>,<br />
indicated by <strong>the</strong> minimum in <strong>the</strong> correlations, is still a point <strong>of</strong> discussion in <strong>the</strong> literature, especially<br />
at high Reynolds numbers. One reason <strong>for</strong> this controversy is <strong>the</strong> dependence <strong>of</strong> this<br />
number on <strong>the</strong> method applied <strong>for</strong> <strong>the</strong> determination <strong>of</strong> <strong>the</strong> wavelength. However, it should be<br />
noted that <strong>the</strong> conditional correlation approach, applied here, is fully based on ma<strong>the</strong>matical<br />
grounds and yields only one well defined value <strong>for</strong> <strong>the</strong> wavelength, instead <strong>of</strong> a streak-spacing<br />
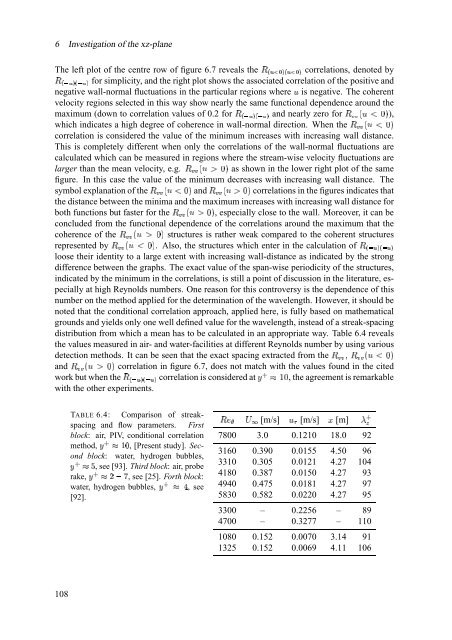
distribution from which a mean has to be calculated in an appropriate way. Table 6.4 reveals<br />
<strong>the</strong> values measured in air- and water-facilities at different Reynolds number by using various<br />
detection methods. It can be seen that <strong>the</strong> exact spacing extracted from ÃËÌË$Á9ÃËÌË ¹ §éº»À¼<br />
<strong>the</strong><br />
ÃËÌË ¹ §¥½#À¼ and correlation in figure 6.7, does not match with <strong>the</strong> values found in <strong>the</strong> cited<br />
work but when ìêïî Ñí êïî Ñí <strong>the</strong> correlation is considered at ª¡À , <strong>the</strong> agreement is remarkable<br />
.®øÊ<br />
with <strong>the</strong> o<strong>the</strong>r experiments.<br />
TABLE 6.4: Comparison <strong>of</strong> streakspacing<br />
and <strong>flow</strong> parameters. First<br />
block: air, PIV, conditional correlation<br />
method, Ó ®jÔ<br />
Ü Ø<br />
, [Present study]. Second<br />
block:<br />
water, hydrogen bubbles,<br />
®ÕÔ×ù<br />
, see [93]. Third block: air, probe<br />
Ó<br />
Ó ® Ô×Úúòû<br />
rake, , see [25]. Forth block:<br />
water, hydrogen Ó ®üÔþý<br />
bubbles, , see<br />
[92].<br />
[m/s] [m/s] [m]<br />
7800 3.0 0.1210 18.0 92<br />
3160 0.390 0.0155 4.50 96<br />
3310 0.305 0.0121 4.27 104<br />
4180 0.387 0.0150 4.27 93<br />
4940 0.475 0.0181 4.27 97<br />
5830 0.582 0.0220 4.27 95<br />
3300 – 0.2256 – 89<br />
4700 – 0.3277 – 110<br />
1080 0.152 0.0070 3.14 91<br />
1325 0.152 0.0069 4.11 106<br />
108


