

The significance of coherent flow structures for the turbulent mixing ...
The significance of coherent flow structures for the turbulent mixing ...
The significance of coherent flow structures for the turbulent mixing ...

Create successful ePaper yourself
Turn your PDF publications into a flip-book with our unique Google optimized e-Paper software.
æ<br />
å<br />
ä<br />
¾<br />
Ó<br />
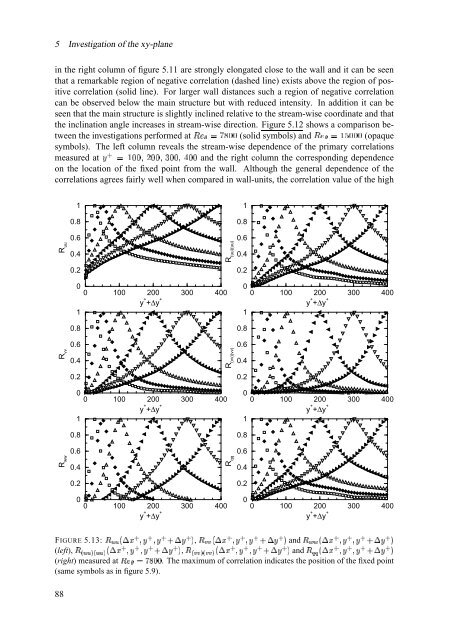
FIGURE 5.13: ç Ï®Ïlè ØUÚ Å/ÛeÜÝÅÛeÜŒÅÞ Ø ÜÝÅ*é , ç ÑÑŒè ØUÚ Å/ÛeÜÝÅÛeÜÝÅÞ Ø ÜÝÅé and ç Ò4Ò/è ØUÚ Å/ÛeÜŒÅ/ÛeÜÝÅöÞ Ø ÜŒÅêé<br />
½<br />
Â<br />
æ<br />
å<br />
<br />
5 Investigation <strong>of</strong> <strong>the</strong> xy-plane<br />
in <strong>the</strong> right column <strong>of</strong> figure 5.11 are strongly elongated close to <strong>the</strong> wall and it can be seen<br />
that a remarkable region <strong>of</strong> negative correlation (dashed line) exists above <strong>the</strong> region <strong>of</strong> positive<br />
correlation (solid line). For larger wall distances such a region <strong>of</strong> negative correlation<br />
can be observed below <strong>the</strong> main structure but with reduced intensity. In addition it can be<br />
seen that <strong>the</strong> main structure is slightly inclined relative to <strong>the</strong> stream-wise coordinate and that<br />
<strong>the</strong> inclination angle increases in stream-wise direction. Figure<br />
½<br />
5.12<br />
¾5À<br />
shows<br />
¢<br />
a<br />
½<br />
comparison<br />
¾©þ©¨<br />
between<br />
<strong>the</strong> investigations ¼×<br />
per<strong>for</strong>med at (solid symbols) and (opaque<br />
¼×<br />
¢ <br />
symbols). <strong>The</strong> left column reveals <strong>the</strong> stream-wise<br />
þ¡<br />
dependence<br />
<br />
<strong>of</strong><br />
<br />
<strong>the</strong><br />
¢ ¢ ¢ <br />
primary correlations<br />
measured at and <strong>the</strong> right column <strong>the</strong> Ä Å<br />
corresponding dependence<br />
on <strong>the</strong> location <strong>of</strong> <strong>the</strong> fixed point from <strong>the</strong> wall. Although <strong>the</strong> general dependence <strong>of</strong> <strong>the</strong><br />
correlations agrees fairly well when compared in wall-units, <strong>the</strong> correlation value <strong>of</strong> <strong>the</strong> high<br />
R uu<br />
1<br />
0.8<br />
0.6<br />
0.4<br />
0.2<br />
R (uu)(uu)<br />
1<br />
0.8<br />
0.6<br />
0.4<br />
0.2<br />
0<br />
1<br />
ã<br />
0<br />
100<br />
ã<br />
ã<br />
200<br />
y + +∆y +<br />
300<br />
ã<br />
400<br />
ã<br />
0<br />
1<br />
ã<br />
0<br />
100<br />
ã<br />
ã<br />
200<br />
y + +∆y +<br />
300<br />
ã<br />
400<br />
ã<br />
0.8<br />
0.8<br />
R vv<br />
0.6<br />
0.4<br />
0.2<br />
R (vv)(vv)<br />
0.6<br />
0.4<br />
0.2<br />
0<br />
1<br />
ã<br />
0<br />
100<br />
ã<br />
ã<br />
200<br />
y + +∆y +<br />
300<br />
ã<br />
400<br />
ã<br />
0<br />
1<br />
ã<br />
0<br />
100<br />
ã<br />
ã<br />
200<br />
y + +∆y +<br />
300<br />
ã<br />
400<br />
ã<br />
0.8<br />
0.8<br />
R ww<br />
0.6<br />
0.4<br />
0.2<br />
R qq<br />
0.6<br />
0.4<br />
0.2<br />
0<br />
ã<br />
0<br />
100<br />
ã<br />
ã<br />
200<br />
y + +∆y +<br />
300<br />
ã<br />
400<br />
ã<br />
0<br />
ã<br />
0<br />
100<br />
ã<br />
ã<br />
200<br />
y + +∆y +<br />
300<br />
ã<br />
400<br />
ã<br />
(left), ç Ï'Ï Ï®Ï è ØUÚ Å ÛeÜ Å ÛeÜ Å Þ Ø Ü Å é , ç ÑÑ ÑÑ è ØÚ Å ÛeÜ Å ÛeÜ Å Þ Ø Ü Å é and ç è ØÚ Å ÛeÜ Å ÛeÜ Å Þ Ø Ü Å é<br />
ߥß<br />
(right) çNì<br />
measured at . <strong>The</strong> maximum <strong>of</strong> correlation indicates <strong>the</strong> position <strong>of</strong> <strong>the</strong> fixed point<br />
(same symbols as in figure 5.9).<br />
88<br />
ËBíî


