

The significance of coherent flow structures for the turbulent mixing ...
The significance of coherent flow structures for the turbulent mixing ...
The significance of coherent flow structures for the turbulent mixing ...

You also want an ePaper? Increase the reach of your titles
YUMPU automatically turns print PDFs into web optimized ePapers that Google loves.
7.3 Spatio-temporal correlations with ¢¡¤£¦¥<br />
<br />
<br />
<br />
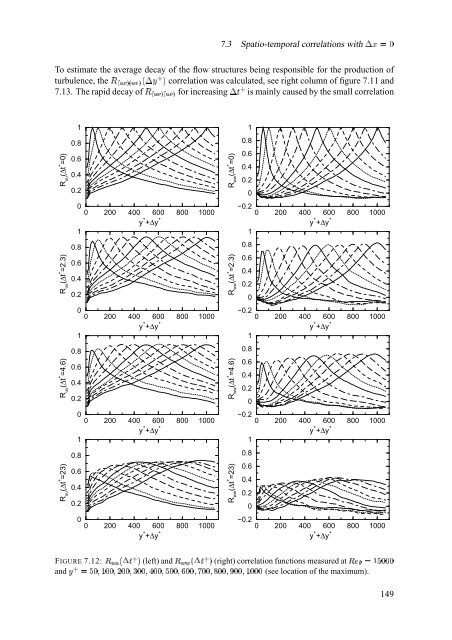
To estimate <strong>the</strong> average decay <strong>of</strong> <strong>the</strong> <strong>flow</strong> <strong>structures</strong> being responsible <strong>for</strong> <strong>the</strong> production<br />
<br />
<strong>of</strong><br />
§©¨¨<br />
turbulence, <strong>the</strong> correlation was calculated, see right column <strong>of</strong> figure 7.11 and<br />
7.13. <strong>The</strong> rapid § ¨¨ decay <strong>of</strong> <strong>for</strong> increasing is mainly caused by <strong>the</strong> small correlation<br />
<br />
1<br />
1<br />
R uu<br />
(∆t + =0)<br />
0.8<br />
0.6<br />
0.4<br />
0.2<br />
R ww<br />
(∆t + =0)<br />
0.8<br />
0.6<br />
0.4<br />
0.2<br />
0<br />
0<br />
1<br />
<br />
0<br />
200<br />
<br />
<br />
400 600<br />
y + +∆y + <br />
800<br />
<br />
1000<br />
<br />
−0.2<br />
1<br />
<br />
0<br />
200<br />
<br />
<br />
400 600<br />
y + +∆y + <br />
800<br />
<br />
1000<br />
<br />
R uu<br />
(∆t + =2.3)<br />
0.8<br />
0.6<br />
0.4<br />
0.2<br />
R ww<br />
(∆t + =2.3)<br />
0.8<br />
0.6<br />
0.4<br />
0.2<br />
0<br />
0<br />
1<br />
<br />
0<br />
200<br />
<br />
<br />
400 600<br />
y + +∆y + <br />
800<br />
<br />
1000<br />
<br />
−0.2<br />
1<br />
<br />
0<br />
200<br />
<br />
<br />
400 600<br />
y + +∆y + <br />
800<br />
<br />
1000<br />
<br />
R uu<br />
(∆t + =4.6)<br />
0.8<br />
0.6<br />
0.4<br />
0.2<br />
R ww<br />
(∆t + =4.6)<br />
0.8<br />
0.6<br />
0.4<br />
0.2<br />
0<br />
0<br />
1<br />
<br />
0<br />
200<br />
<br />
<br />
400 600<br />
y + +∆y + <br />
800<br />
<br />
1000<br />
<br />
−0.2<br />
1<br />
<br />
0<br />
200<br />
<br />
<br />
400 600<br />
y + +∆y + <br />
800<br />
<br />
1000<br />
<br />
R uu<br />
(∆t + =23)<br />
0.8<br />
0.6<br />
0.4<br />
0.2<br />
R ww<br />
(∆t + =23)<br />
0.8<br />
0.6<br />
0.4<br />
0.2<br />
0<br />
0<br />
<br />
0<br />
200<br />
<br />
400<br />
<br />
600<br />
<br />
y + +∆y +<br />
800<br />
<br />
1000<br />
<br />
−0.2<br />
<br />
0<br />
200<br />
<br />
400<br />
<br />
600<br />
<br />
y + +∆y +<br />
800<br />
<br />
1000<br />
<br />
FIGURE ! #"%$<br />
7.12: (left) )(( #"%$ and (right) correlation functions measured +*,.-0/1324242<br />
at<br />
5 -613287/924287:324287;3242877?4242@7AB2=287C32=287D3242@7/242=2 and (see location <strong>of</strong> <strong>the</strong> maximum).<br />
'&<br />
'&<br />
149


