

The significance of coherent flow structures for the turbulent mixing ...
The significance of coherent flow structures for the turbulent mixing ...
The significance of coherent flow structures for the turbulent mixing ...

You also want an ePaper? Increase the reach of your titles
YUMPU automatically turns print PDFs into web optimized ePapers that Google loves.
6 Investigation <strong>of</strong> <strong>the</strong> xz-plane<br />
300<br />
250<br />
200<br />
Vortex pair<br />
z<br />
+<br />
150<br />
Vortex pair<br />
Vortex pair<br />
100<br />
50<br />
0<br />
0 50 100 150 200 250 300 350 400 450 500 550<br />
300<br />
250<br />
??]<br />
x [???]<br />
z<br />
+<br />
200<br />
150<br />
Q2<br />
Q2<br />
Q4<br />
Q2<br />
100<br />
Q2<br />
50<br />
Q4<br />
0<br />
0 50 100 150 200 250 300 350 400 450 500 550<br />
x<br />
+<br />
y [???]<br />
x [???]<br />
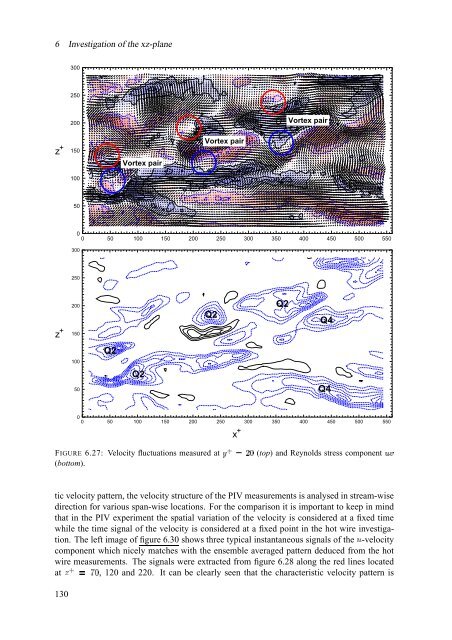
FIGURE 6.27: Velocity fluctuations measured at Ó ® Ú¥Ø<br />
(top) and Reynolds stress component &C<br />
(bottom).<br />
tic velocity pattern, <strong>the</strong> velocity structure <strong>of</strong> <strong>the</strong> PIV measurements is analysed in stream-wise<br />
direction <strong>for</strong> various span-wise locations. For <strong>the</strong> comparison it is important to keep in mind<br />
that in <strong>the</strong> PIV experiment <strong>the</strong> spatial variation <strong>of</strong> <strong>the</strong> velocity is considered at a fixed time<br />
while <strong>the</strong> time signal <strong>of</strong> <strong>the</strong> velocity is considered at a fixed point in <strong>the</strong> hot wire investigation.<br />
<strong>The</strong> left image <strong>of</strong> figure 6.30 shows three typical instantaneous signals <strong>of</strong> <strong>the</strong> § -velocity<br />
component which nicely matches with <strong>the</strong> ensemble averaged pattern deduced from <strong>the</strong> hot<br />
wire measurements. <strong>The</strong> signals were extracted from figure 6.28 along <strong>the</strong> red lines located<br />
at Ï ® ¿ ÈÀ , 120 and 220. It can be clearly seen that <strong>the</strong> characteristic velocity pattern is<br />
130


