

The significance of coherent flow structures for the turbulent mixing ...
The significance of coherent flow structures for the turbulent mixing ...
The significance of coherent flow structures for the turbulent mixing ...

Create successful ePaper yourself
Turn your PDF publications into a flip-book with our unique Google optimized e-Paper software.
4.8 Feasibility study<br />
10 20 30 40 50 60 70 80 10 20 30 40 50 60 70 80<br />
Streamwise direction [mm]<br />
Streamwise direction [mm]<br />
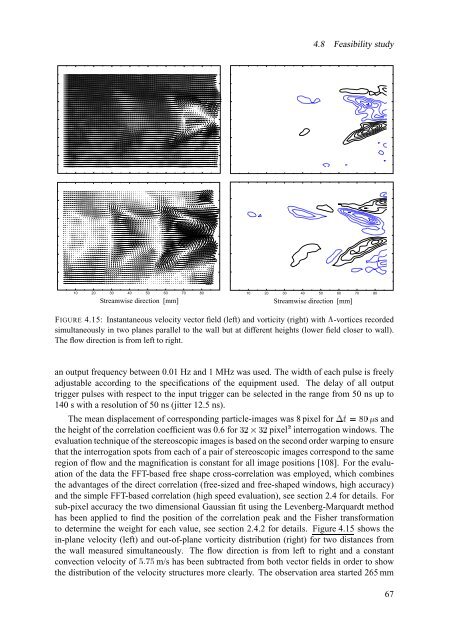
FIGURE 4.15: Instantaneous velocity vector field (left) and vorticity (right) with Ñ -vortices recorded<br />
simultaneously in two planes parallel to <strong>the</strong> wall but at different heights (lower field closer to wall).<br />
<strong>The</strong> <strong>flow</strong> direction is from left to right.<br />
an output frequency between 0.01 Hz and 1 MHz was used. <strong>The</strong> width <strong>of</strong> each pulse is freely<br />
adjustable according to <strong>the</strong> specifications <strong>of</strong> <strong>the</strong> equipment used. <strong>The</strong> delay <strong>of</strong> all output<br />
trigger pulses with respect to <strong>the</strong> input trigger can be selected in <strong>the</strong> range from 50 ns up to<br />
140 s with a resolution <strong>of</strong> 50 ns (jitter 12.5 ns).<br />
<strong>The</strong> mean displacement <strong>of</strong> corresponding particle-images was 8 pixel <strong>for</strong> ³æå”Ø©Þ¿¾çÕ s and<br />
<strong>the</strong> height <strong>of</strong> <strong>the</strong> correlation coefficient was 0.6 <strong>for</strong> ÂÛ)ÄèÂ0Û pixelÊ interrogation windows. <strong>The</strong><br />
evaluation technique <strong>of</strong> <strong>the</strong> stereoscopic images is based on <strong>the</strong> second order warping to ensure<br />
that <strong>the</strong> interrogation spots from each <strong>of</strong> a pair <strong>of</strong> stereoscopic images correspond to <strong>the</strong> same<br />
region <strong>of</strong> <strong>flow</strong> and <strong>the</strong> magnification is constant <strong>for</strong> all image positions [108]. For <strong>the</strong> evaluation<br />
<strong>of</strong> <strong>the</strong> data <strong>the</strong> FFT-based free shape cross-correlation was employed, which combines<br />
<strong>the</strong> advantages <strong>of</strong> <strong>the</strong> direct correlation (free-sized and free-shaped windows, high accuracy)<br />
and <strong>the</strong> simple FFT-based correlation (high speed evaluation), see section 2.4 <strong>for</strong> details. For<br />
sub-pixel accuracy <strong>the</strong> two dimensional Gaussian fit using <strong>the</strong> Levenberg-Marquardt method<br />
has been applied to find <strong>the</strong> position <strong>of</strong> <strong>the</strong> correlation peak and <strong>the</strong> Fisher trans<strong>for</strong>mation<br />
to determine <strong>the</strong> weight <strong>for</strong> each value, see section 2.4.2 <strong>for</strong> details. Figure 4.15 shows <strong>the</strong><br />
in-plane velocity (left) and out-<strong>of</strong>-plane vorticity distribution (right) <strong>for</strong> two distances from<br />
<strong>the</strong> wall measured simultaneously. <strong>The</strong> <strong>flow</strong> direction is from left to right and a constant<br />
convection velocity <strong>of</strong> ÈOÁÉÎÈ m/s has been subtracted from both vector fields in order to show<br />
<strong>the</strong> distribution <strong>of</strong> <strong>the</strong> velocity <strong>structures</strong> more clearly. <strong>The</strong> observation area started 265 mm<br />
67


