

The significance of coherent flow structures for the turbulent mixing ...
The significance of coherent flow structures for the turbulent mixing ...
The significance of coherent flow structures for the turbulent mixing ...

Create successful ePaper yourself
Turn your PDF publications into a flip-book with our unique Google optimized e-Paper software.
M<br />
M<br />
æ<br />
æ<br />
æ<br />
æ<br />
æ<br />
æ<br />
ã<br />
ã<br />
ã<br />
H<br />
M<br />
M<br />
I<br />
I<br />
I<br />
I<br />
I<br />
I<br />
I<br />
ã<br />
ã<br />
ã<br />
6.3 Spatio-temporal buffer layer statistics<br />
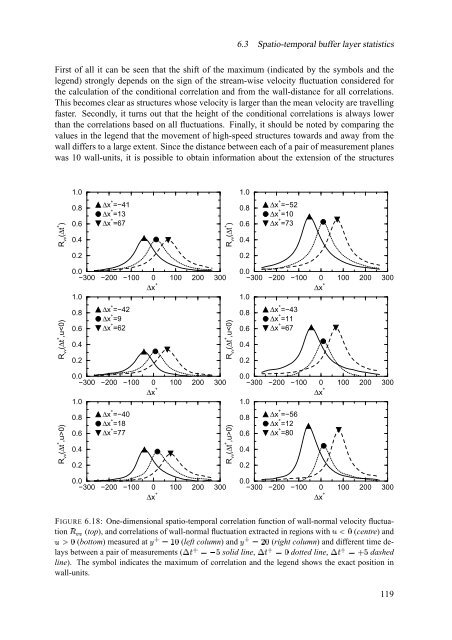
First <strong>of</strong> all it can be seen that <strong>the</strong> shift <strong>of</strong> <strong>the</strong> maximum (indicated by <strong>the</strong> symbols and <strong>the</strong><br />
legend) strongly depends on <strong>the</strong> sign <strong>of</strong> <strong>the</strong> stream-wise velocity fluctuation considered <strong>for</strong><br />
<strong>the</strong> calculation <strong>of</strong> <strong>the</strong> conditional correlation and from <strong>the</strong> wall-distance <strong>for</strong> all correlations.<br />
This becomes clear as <strong>structures</strong> whose velocity is larger than <strong>the</strong> mean velocity are travelling<br />
faster. Secondly, it turns out that <strong>the</strong> height <strong>of</strong> <strong>the</strong> conditional correlations is always lower<br />
than <strong>the</strong> correlations based on all fluctuations. Finally, it should be noted by comparing <strong>the</strong><br />
values in <strong>the</strong> legend that <strong>the</strong> movement <strong>of</strong> high-speed <strong>structures</strong> towards and away from <strong>the</strong><br />
wall differs to a large extent. Since <strong>the</strong> distance between each <strong>of</strong> a pair <strong>of</strong> measurement planes<br />
was 10 wall-units, it is possible to obtain in<strong>for</strong>mation about <strong>the</strong> extension <strong>of</strong> <strong>the</strong> <strong>structures</strong><br />
1.0<br />
1.0<br />
R vv<br />
(∆t + )<br />
0.8<br />
0.6<br />
0.4<br />
æ<br />
∆x + =−41<br />
∆x + =13<br />
∆x + =67<br />
t + )<br />
R vv<br />
(∆<br />
0.8<br />
0.6<br />
0.4<br />
I<br />
∆x + =−52<br />
∆x + =10<br />
∆x + =73<br />
0.2<br />
0.2<br />
ã<br />
0.0<br />
−300 −200 −100 0 100<br />
∆x<br />
1.0<br />
200<br />
ã<br />
300<br />
ã<br />
0.0<br />
−300 −200 −100<br />
1.0<br />
ã<br />
0<br />
∆x<br />
+<br />
100<br />
ã<br />
200<br />
ã<br />
300<br />
ã<br />
R vv<br />
(∆t + ,u0)<br />
0.8<br />
0.6<br />
0.4<br />
0.2<br />
∆x + =−56<br />
∆x + =12<br />
∆x + =80<br />
ã 0.0<br />
−300 −200 −100 0 100<br />
∆x +<br />
200<br />
ã<br />
300<br />
ã<br />
0.0<br />
−300 −200 −100<br />
ã<br />
0<br />
∆x +<br />
100<br />
ã<br />
200<br />
ã<br />
300<br />
ã<br />
FIGURE 6.18: One-dimensional spatio-temporal correlation function <strong>of</strong> wall-normal velocity fluctuation<br />
Ð ËÛË (top), and correlations <strong>of</strong> wall-normal fluctuation extracted in regions with N Ø<br />
(centre) and<br />
O! Ø<br />
(bottom) measured at Ó ® Ü Ø<br />
(left column) and Ó ® Ú¥Ø<br />
(right column) and different time delays<br />
between a pair <strong>of</strong> measurements (KJ ® ú ù<br />
solid line, KJ ® Ø<br />
dotted line, J ® P6 ù<br />
dashed<br />
line). <strong>The</strong> symbol indicates <strong>the</strong> maximum <strong>of</strong> correlation and <strong>the</strong> legend shows <strong>the</strong> exact position in<br />
wall-units.<br />
119


