

The significance of coherent flow structures for the turbulent mixing ...
The significance of coherent flow structures for the turbulent mixing ...
The significance of coherent flow structures for the turbulent mixing ...

You also want an ePaper? Increase the reach of your titles
YUMPU automatically turns print PDFs into web optimized ePapers that Google loves.
6 Investigation <strong>of</strong> <strong>the</strong> xz-plane<br />
300<br />
250<br />
200<br />
z<br />
+<br />
150<br />
100<br />
50<br />
0<br />
0 50 100 150 200 250 300 350 400 450 500 550<br />
300<br />
y [???]<br />
250<br />
x [???]<br />
200<br />
z<br />
+<br />
150<br />
100<br />
50<br />
0<br />
0 50 100 150 200 250 300 350 400 450 500 550<br />
x<br />
+<br />
y [???]<br />
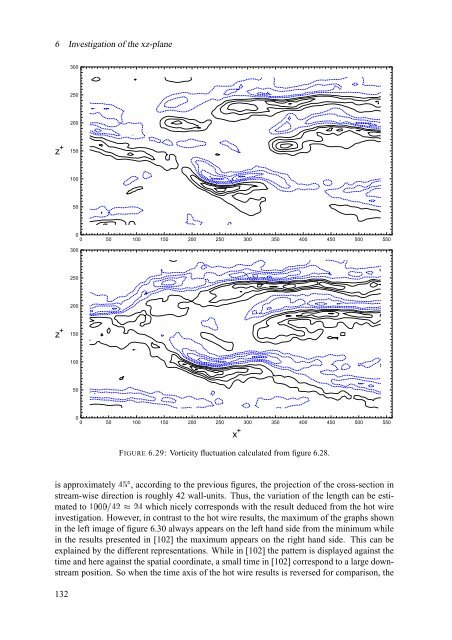
FIGURE 6.29: Vorticity fluctuation calculated from figure 6.28.<br />
x [???]<br />
is approximately © Çcb<br />
, according to <strong>the</strong> previous figures, <strong>the</strong> projection <strong>of</strong> <strong>the</strong> cross-section in<br />
stream-wise direction is roughly 42 wall-units. Thus, <strong>the</strong> variation <strong>of</strong> <strong>the</strong> length can be estimated<br />
to ª¥À¢À¢À ¸ © ¨ Ê<br />
investigation. However, in contrast to <strong>the</strong> hot wire results, <strong>the</strong> maximum <strong>of</strong> <strong>the</strong> graphs shown<br />
in <strong>the</strong> left image <strong>of</strong> figure 6.30 always appears on <strong>the</strong> left hand side from <strong>the</strong> minimum while<br />
in <strong>the</strong> results presented in [102] <strong>the</strong> maximum appears on <strong>the</strong> right hand side. This can be<br />
explained by <strong>the</strong> different representations. While in [102] <strong>the</strong> pattern is displayed against <strong>the</strong><br />
time and here against <strong>the</strong> spatial coordinate, a small time in [102] correspond to a large downstream<br />
position. So when <strong>the</strong> time axis <strong>of</strong> <strong>the</strong> hot wire results is reversed <strong>for</strong> comparison, <strong>the</strong><br />
132<br />
¨ © which nicely corresponds with <strong>the</strong> result deduced from <strong>the</strong> hot wire


