

The significance of coherent flow structures for the turbulent mixing ...
The significance of coherent flow structures for the turbulent mixing ...
The significance of coherent flow structures for the turbulent mixing ...

You also want an ePaper? Increase the reach of your titles
YUMPU automatically turns print PDFs into web optimized ePapers that Google loves.
ƒ„<br />
„ ƒ<br />
ƒ„<br />
ƒ„<br />
„ ƒ<br />
ƒ„<br />
ƒ„<br />
„ ƒ<br />
…<br />
…<br />
…<br />
…<br />
…<br />
7 Investigation <strong>of</strong> <strong>the</strong> yz-plane<br />
<strong>of</strong> <strong>the</strong> data. As <strong>the</strong> <strong>flow</strong> <strong>structures</strong> and <strong>the</strong>ir spatial organisation change while <strong>the</strong>y are transported<br />
downstream, <strong>the</strong> various correlation values yield in<strong>for</strong>mation about <strong>the</strong>ir life history.<br />
This is in some extent similar to <strong>the</strong> image analysis in PIV where <strong>the</strong> position, size, shape<br />
and intensity <strong>of</strong> <strong>the</strong> signal-peak in <strong>the</strong> correlation domain yield statistical in<strong>for</strong>mation about<br />
<strong>the</strong> size and shape <strong>of</strong> <strong>the</strong> particle images <strong>the</strong>mselves as well as in<strong>for</strong>mation about <strong>the</strong> magnitude,<br />
direction and homogeneity <strong>of</strong> <strong>the</strong> displacement <strong>of</strong> <strong>the</strong> particle ensemble in between <strong>the</strong><br />
two illuminations. <strong>The</strong> main difference lies in <strong>the</strong> fact that <strong>the</strong> fluid mechanical correlations<br />
presented in <strong>the</strong> following are ensemble averages calculated over hundreds <strong>of</strong> realizations,<br />
whereas in PIV <strong>the</strong> ensemble average is replaced by <strong>the</strong> spatial average <strong>of</strong> a single realization.<br />
This implies that in our case <strong>the</strong> statistical process leading to <strong>the</strong> fluid mechanical correlation<br />
functions must not necessarily be ergodic as required <strong>for</strong> PIV image analysis.<br />
Intensity<br />
Intensity<br />
x<br />
∆ ~ x<br />
∆τ<br />
∆t<br />
t<br />
x<br />
∆x<br />
∆τ<br />
…<br />
…<br />
…<br />
∆t<br />
∆ ~ x<br />
t<br />
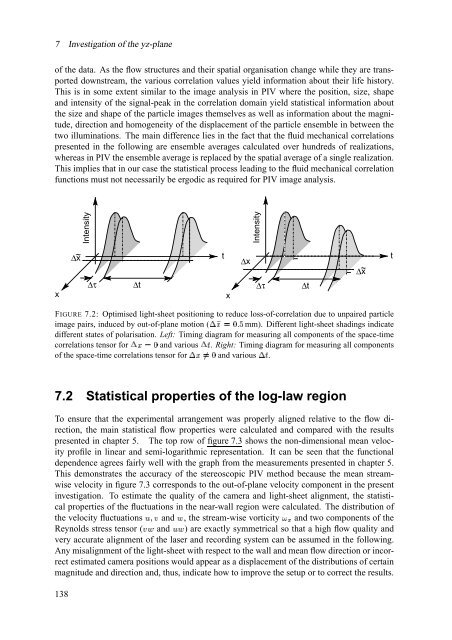
FIGURE 7.2: Optimised light-sheet positioning to reduce loss-<strong>of</strong>-correlation due to unpaired particle<br />
image pairs, induced by out-<strong>of</strong>-plane (F† " ؇mù<br />
motion mm). Different light-sheet shadings indicate<br />
different states <strong>of</strong> polarisation. Left: Timing diagram <strong>for</strong> measuring all components <strong>of</strong> <strong>the</strong> space-time<br />
correlations tensor K+ Ø<br />
<strong>for</strong> and KJ various . Right: Timing diagram <strong>for</strong> measuring all components<br />
<strong>of</strong> <strong>the</strong> space-time correlations tensor <strong>for</strong> K‰ˆ<br />
Ø<br />
and various KJ .<br />
7.2 Statistical properties <strong>of</strong> <strong>the</strong> log-law region<br />
To ensure that <strong>the</strong> experimental arrangement was properly aligned relative to <strong>the</strong> <strong>flow</strong> direction,<br />
<strong>the</strong> main statistical <strong>flow</strong> properties were calculated and compared with <strong>the</strong> results<br />
presented in chapter 5. <strong>The</strong> top row <strong>of</strong> figure 7.3 shows <strong>the</strong> non-dimensional mean velocity<br />
pr<strong>of</strong>ile in linear and semi-logarithmic representation. It can be seen that <strong>the</strong> functional<br />
dependence agrees fairly well with <strong>the</strong> graph from <strong>the</strong> measurements presented in chapter 5.<br />
This demonstrates <strong>the</strong> accuracy <strong>of</strong> <strong>the</strong> stereoscopic PIV method because <strong>the</strong> mean streamwise<br />
velocity in figure 7.3 corresponds to <strong>the</strong> out-<strong>of</strong>-plane velocity component in <strong>the</strong> present<br />
investigation. To estimate <strong>the</strong> quality <strong>of</strong> <strong>the</strong> camera and light-sheet alignment, <strong>the</strong> statistical<br />
properties <strong>of</strong> <strong>the</strong> fluctuations in <strong>the</strong> near-wall region were calculated. <strong>The</strong> distribution <strong>of</strong><br />
<strong>the</strong> velocity fluctuations and , <strong>the</strong> stream-wise vorticity a‹x and two components <strong>of</strong> <strong>the</strong><br />
|‹Š:Œ<br />
Reynolds stress tensor ( Πand | ) are exactly symmetrical so that a high <strong>flow</strong> quality and<br />
very accurate alignment <strong>of</strong> <strong>the</strong> laser and recording system can be assumed in <strong>the</strong> following.<br />
Any misalignment <strong>of</strong> <strong>the</strong> light-sheet with respect to <strong>the</strong> wall and mean <strong>flow</strong> direction or incorrect<br />
estimated camera positions would appear as a displacement <strong>of</strong> <strong>the</strong> distributions <strong>of</strong> certain<br />
magnitude and direction and, thus, indicate how to improve <strong>the</strong> setup or to correct <strong>the</strong> results.<br />
138


