

The significance of coherent flow structures for the turbulent mixing ...
The significance of coherent flow structures for the turbulent mixing ...
The significance of coherent flow structures for the turbulent mixing ...

Create successful ePaper yourself
Turn your PDF publications into a flip-book with our unique Google optimized e-Paper software.
7.4 Spatio-temporal correlations with çéè<br />
£<br />
ë<br />
£<br />
7 Investigation <strong>of</strong> <strong>the</strong> yz-plane<br />
<br />
ê<br />
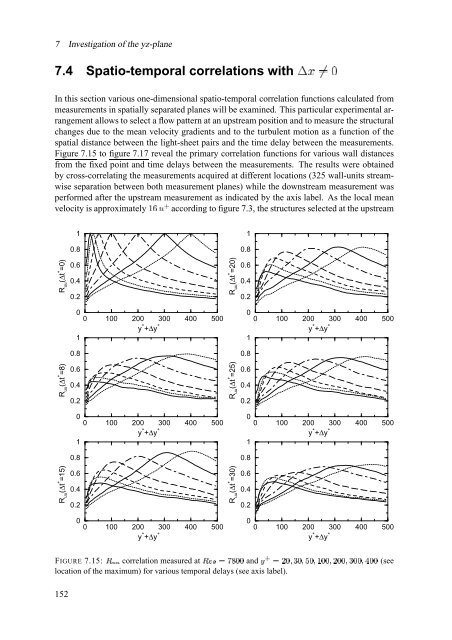
In this section various one-dimensional spatio-temporal correlation functions calculated from<br />
measurements in spatially separated planes will be examined. This particular experimental arrangement<br />
allows to select a <strong>flow</strong> pattern at an upstream position and to measure <strong>the</strong> structural<br />
changes due to <strong>the</strong> mean velocity gradients and to <strong>the</strong> <strong>turbulent</strong> motion as a function <strong>of</strong> <strong>the</strong><br />
spatial distance between <strong>the</strong> light-sheet pairs and <strong>the</strong> time delay between <strong>the</strong> measurements.<br />
Figure 7.15 to figure 7.17 reveal <strong>the</strong> primary correlation functions <strong>for</strong> various wall distances<br />
from <strong>the</strong> fixed point and time delays between <strong>the</strong> measurements. <strong>The</strong> results were obtained<br />
by cross-correlating <strong>the</strong> measurements acquired at different locations (325 wall-units streamwise<br />
separation between both measurement planes) while <strong>the</strong> downstream measurement was<br />
per<strong>for</strong>med after <strong>the</strong> upstream measurement as indicated by <strong>the</strong> axis label. As <strong>the</strong> local mean<br />
velocity is approximately ¿ ä » according to figure 7.3, <strong>the</strong> <strong>structures</strong> selected at <strong>the</strong> upstream<br />
1<br />
1<br />
0.8<br />
0.8<br />
R uu<br />
(∆t + =0)<br />
0.6<br />
0.4<br />
0.2<br />
R uu<br />
(∆t + =20)<br />
0.6<br />
0.4<br />
0.2<br />
0<br />
1<br />
£<br />
0<br />
100<br />
£<br />
200<br />
£<br />
y + +∆y +<br />
300<br />
£<br />
400<br />
£<br />
500<br />
£<br />
0<br />
1<br />
£<br />
0<br />
100<br />
£<br />
200<br />
£<br />
y + +∆y +<br />
300<br />
£<br />
400<br />
£<br />
500<br />
£<br />
0.8<br />
0.8<br />
R uu<br />
(∆t + =8)<br />
0.6<br />
0.4<br />
0.2<br />
R uu<br />
(∆t + =25)<br />
0.6<br />
0.4<br />
0.2<br />
0<br />
1<br />
£<br />
0<br />
100<br />
£<br />
£<br />
200 300<br />
y + +∆y + ¤<br />
400<br />
£<br />
500<br />
£<br />
0<br />
1<br />
£<br />
0<br />
100<br />
£<br />
£<br />
200 300<br />
y + +∆y + ¤<br />
400<br />
£<br />
500<br />
£<br />
0.8<br />
0.8<br />
R uu<br />
(∆t + =15)<br />
0.6<br />
0.4<br />
0.2<br />
R uu<br />
(∆t + =30)<br />
0.6<br />
0.4<br />
0.2<br />
0<br />
£<br />
0<br />
100<br />
£<br />
200<br />
£<br />
y + +∆y +<br />
300<br />
£<br />
400<br />
£<br />
500<br />
£<br />
0<br />
£<br />
0<br />
100<br />
£<br />
200<br />
£<br />
y + +∆y +<br />
300<br />
£<br />
400<br />
£<br />
500<br />
£<br />
FIGURE 7.15: ˜ ·· correlation measured at ˜ášLœ§§žž and © » š<br />
location <strong>of</strong> <strong>the</strong> maximum) <strong>for</strong> various temporal delays (see axis label).<br />
152<br />
Ñ ž Æ Î§ž ÆËÏ ž ÆÐ žž ÆËÑ žž Æ Îžž ÆËÒ ž±ž (see


