

2013-vinci-annual-report
2013-vinci-annual-report
2013-vinci-annual-report

Create successful ePaper yourself
Turn your PDF publications into a flip-book with our unique Google optimized e-Paper software.
1.7. Balance sheet and net financial debt<br />
Consolidated non-current assets amounted to €38.0 billion at 31 December <strong>2013</strong> (€35.3 billion at 31 December 2012). They consisted mainly<br />
of concession assets (€29.6 billion). After taking account of a working capital surplus (attributable mainly to the Contracting business) of<br />
€6.6 billion, down €80 million compared with 31 December 2012, consolidated capital employed was €31.4 billion at 31 December <strong>2013</strong><br />
(€28.6 billion at the end of 2012).<br />
The Concessions business accounted for almost 90% of total capital employed (87% at 31 December 2012).<br />
122 VINCI <strong>2013</strong> ANNUAL REPORT<br />
The Group’s equity rose to €14.3 billion at 31 December <strong>2013</strong> from €13.8 billion at 31 December 2012. It includes €118 million relating to<br />
non-controlling interests.<br />
The number of shares, excluding treasury shares, was 556,953,101 at 31 December <strong>2013</strong> (536,245,294 at 31 December 2012).<br />
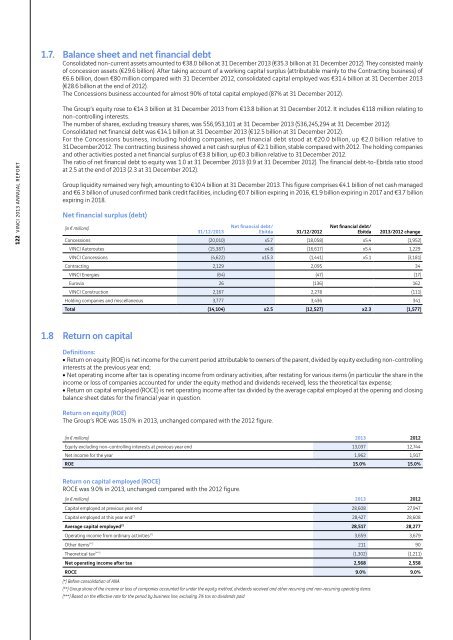
Consolidated net financial debt was €14.1 billion at 31 December <strong>2013</strong> (€12.5 billion at 31 December 2012).<br />
For the Concessions business, including holding companies, net financial debt stood at €20.0 billion, up €2.0 billion relative to<br />
31 December 2012. The contracting business showed a net cash surplus of €2.1 billion, stable compared with 2012. The holding companies<br />
and other activities posted a net financial surplus of €3.8 billion, up €0.3 billion relative to 31 December 2012.<br />
The ratio of net financial debt to equity was 1.0 at 31 December <strong>2013</strong> (0.9 at 31 December 2012). The financial debt-to-Ebitda ratio stood<br />
at 2.5 at the end of <strong>2013</strong> (2.3 at 31 December 2012).<br />
Group liquidity remained very high, amounting to €10.4 billion at 31 December <strong>2013</strong>. This figure comprises €4.1 billion of net cash managed<br />
and €6.3 billion of unused confirmed bank credit facilities, including €0.7 billion expiring in 2016, €1.9 billion expiring in 2017 and €3.7 billion<br />
expiring in 2018.<br />
Net financial surplus (debt)<br />
(in € millions)<br />
31/12/<strong>2013</strong><br />
Net financial debt/<br />
Ebitda 31/12/2012<br />
Net financial debt/<br />
Ebitda <strong>2013</strong>/2012 change<br />
Concessions (20,010) x5.7 (18,058) x5.4 (1,952)<br />
VINCI Autoroutes (15,387) x4.8 (16,617) x5.4 1,229<br />
VINCI Concessions (4,622) x15.3 (1,441) x5.1 (3,181)<br />
Contracting 2,129 2,095 34<br />
VINCI Energies (64) (47) (17)<br />
Eurovia 26 (136) 162<br />
VINCI Construction 2,167 2,278 (111)<br />
Holding companies and miscellaneous 3,777 3,436 341<br />
Total (14,104) x2.5 (12,527) x2.3 (1,577)<br />
1.8 Return on capital<br />
Definitions:<br />
ˇˇReturn on equity (ROE) is net income for the current period attributable to owners of the parent, divided by equity excluding non-controlling<br />
interests at the previous year end;<br />
ˇˇNet operating income after tax is operating income from ordinary activities, after restating for various items (in particular the share in the<br />
income or loss of companies accounted for under the equity method and dividends received), less the theoretical tax expense;<br />
ˇˇReturn on capital employed (ROCE) is net operating income after tax divided by the average capital employed at the opening and closing<br />
balance sheet dates for the financial year in question.<br />
Return on equity (ROE)<br />
The Group’s ROE was 15.0% in <strong>2013</strong>, unchanged compared with the 2012 figure.<br />
(in € millions) <strong>2013</strong> 2012<br />
Equity excluding non-controlling interests at previous year end 13,037 12,744<br />
Net income for the year 1,962 1,917<br />
ROE 15.0% 15.0%<br />
Return on capital employed (ROCE)<br />
ROCE was 9.0% in <strong>2013</strong>, unchanged compared with the 2012 figure.<br />
(in € millions) <strong>2013</strong> 2012<br />
Capital employed at previous year end 28,608 27,947<br />
Capital employed at this year end (*) 28,427 28,608<br />
Average capital employed (*) 28,517 28,277<br />
Operating income from ordinary activities (*) 3,659 3,679<br />
Other items (**) 211 90<br />
Theoretical tax (***) (1,302) (1,211)<br />
Net operating income after tax 2,568 2,558<br />
ROCE 9.0% 9.0%<br />
(*) Before consolidation of ANA.<br />
(**) Group share of the income or loss of companies accounted for under the equity method, dividends received and other recurring and non-recurring operating items.<br />
(***) Based on the effective rate for the period by business line, excluding 3% tax on dividends paid.