- Page 1 and 2: ANNUAL REPORT 2013
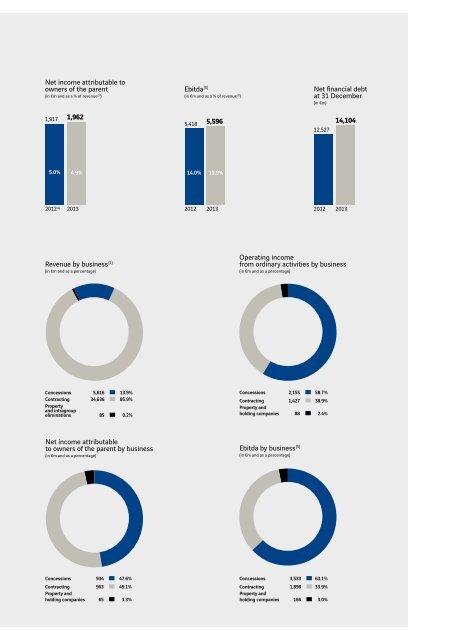
- Page 3: KEY FIGURES €40.3 billion REVENUE
- Page 7 and 8: GROUP / 2013 ALBUM 03 Finalised in
- Page 9 and 10: GROUP / 2013 ALBUM 05 Having built
- Page 11 and 12: GROUP / 2013 ALBUM 07 includes Euro
- Page 13 and 14: GROUP / 2013 ALBUM 09 Actemium, the
- Page 15 and 16: GROUP / 2013 ALBUM 11 Launched duri
- Page 17 and 18: GROUP / 2013 ALBUM 13 components, e
- Page 19 and 20: GROUP / 2013 ALBUM 15 permanent tra
- Page 21 and 22: CORPORATE GOVERNANCE Board of Direc
- Page 23 and 24: 04 05 2014 Management and Coordinat
- Page 25 and 26: Milestones 02 01 VINCI’s drive to
- Page 27 and 28: Our Group is multi-local and multi-
- Page 29 and 30: DESIGN AND BUILD TOGETHER We commit
- Page 31 and 32: PROMOTE GREEN GROWTH TOGETHER We co
- Page 33 and 34: STRIVE FOR ZERO ACCIDENTS TOGETHER
- Page 35 and 36: PROMOTE SUSTAINABLE CAREERS TOGETHE
- Page 37 and 38: INNOVATING TO CREATE VALUE The Grou
- Page 39 and 40: Return on investment in VINCI share
- Page 41 and 42: CONCESSIONS VINCI AUTOROUTES VINCI
- Page 43 and 44: Rail infrastructure Parking facilit
- Page 45 and 46: Profile VINCI Autoroutes designs, b
- Page 47 and 48: CREATING LONG-TERM VALUE VINCI AUTO
- Page 49 and 50: 01 Light-vehicle traffic on the int
- Page 51 and 52: VINCI’s motorway concessions in F
- Page 53 and 54: BUILDING AWARENESS A DIFFERENT ANGL
- Page 55 and 56:
01 The “100% worksite safety” a
- Page 57 and 58:
Miscellaneous Cofiroute USA, which
- Page 59 and 60:
Profile Through its three areas of
- Page 61 and 62:
NEW DIMENSION IN AIRPORTS VINCI CON
- Page 63 and 64:
01 Extension of the Siem Reap and P
- Page 65 and 66:
02 04 01 The East End Crossing proj
- Page 67 and 68:
VINCI Park’s competitive position
- Page 69 and 70:
continued to roll out the GSM-Rail
- Page 71 and 72:
ALLIANZ RIVIERA, NICE NOT JUST A ST
- Page 73 and 74:
Outlook the owner and granting auth
- Page 75 and 76:
CONTRACTING VINCI ENERGIES EUROVIA
- Page 77 and 78:
Profile VINCI Energies serves publi
- Page 79 and 80:
RESILIENCE AND NETWORK MOMENTUM VIN
- Page 81 and 82:
250 BUSINESS UNITS IN 15 COUNTRIES
- Page 83 and 84:
CERGY PONTOISE CREATING A LIGHTING
- Page 85 and 86:
02 03 04 01 In Belgium, Actemium im
- Page 87 and 88:
02 CONTRACTING / VINCI ENERGIES 83
- Page 89 and 90:
Profile Eurovia is a world leader i
- Page 91 and 92:
RESILIENT RESPONSE TO THE ECONOMIC
- Page 93 and 94:
CONTRACTING / EUROVIA 89 03 of 2013
- Page 95 and 96:
PEYROLLES EN PROVENCE TRANSFORMING
- Page 97 and 98:
03 02 04 01 In the United Kingdom,
- Page 99 and 100:
Outlook continued construction of 2
- Page 101 and 102:
Profile VINCI Construction, France
- Page 103 and 104:
GROWTH AND INTERNATIONAL DEVELOPMEN
- Page 105 and 106:
CONTRACTING / VINCI CONSTRUCTION 10
- Page 107 and 108:
02 03 01 In Lyon, eastern France, t
- Page 109 and 110:
SITA OUEDRAOGO, farmer “We had tr
- Page 111 and 112:
main activities focused on the SEA
- Page 113 and 114:
Outlook in Tajikistan, the new term
- Page 115 and 116:
Located within the Fortdissy.com cy
- Page 117 and 118:
General & financial elements 114 Re
- Page 119 and 120:
A. Report on the financial statemen
- Page 121 and 122:
Change in the presentation of the c
- Page 123 and 124:
1.3 Operating income from ordinary
- Page 125 and 126:
Cash flow from operations (Ebitda)
- Page 127 and 128:
2. Parent company financial stateme
- Page 129 and 130:
C. Risk factors Numerous internal a
- Page 131 and 132:
Regarding concessions operation, th
- Page 133 and 134:
3. Legal risks 3.1 Legal and regula
- Page 135 and 136:
5.2 Loss prevention and claims reco
- Page 137 and 138:
At its meeting of 5 February 2014,
- Page 139 and 140:
Yannick Assouad (*) Chief Executive
- Page 141 and 142:
Jean-Bernard Lévy (*) Chairman and
- Page 143 and 144:
3.1.2 Individual whose appointment
- Page 145 and 146:
3.3 Composition of the Board of Dir
- Page 147 and 148:
3.4 Personal situation of company o
- Page 149 and 150:
Audit Committee meetings dealt with
- Page 151 and 152:
3.7 Assessment of the composition a
- Page 153 and 154:
(a) Summary of remuneration due in
- Page 155 and 156:
4.1.4.3 Long-term incentive plan Mr
- Page 157 and 158:
5.2 Share subscription option plans
- Page 159 and 160:
The definitive granting of shares i
- Page 161 and 162:
1. Workforce-related information 1.
- Page 163 and 164:
Workforce at 31 December 2013 by ty
- Page 165 and 166:
1.4.2 Remuneration and social secur
- Page 167 and 168:
1.5.4 Collective agreements in 2013
- Page 169 and 170:
The gap between the accident freque
- Page 171 and 172:
The activity of Trajeo’h, an enti
- Page 173 and 174:
Group activities covered by ISO 140
- Page 175 and 176:
Total energy consumption (including
- Page 177 and 178:
Recycling has been a priority at Eu
- Page 179 and 180:
Eurovia also received SNB recogniti
- Page 181 and 182:
3. Social information 3.1 Regional,
- Page 183 and 184:
One of these prizes went to the Sou
- Page 185 and 186:
(see page 180), the environment and
- Page 187 and 188:
ˇˇ for environmental indicators:
- Page 189 and 190:
F. General information about the Co
- Page 191 and 192:
2.3 Movements of funds between the
- Page 193 and 194:
3.4 Treasury shares The disclosures
- Page 195 and 196:
The authorisations proposed to the
- Page 197 and 198:
We determined the nature and scope
- Page 199 and 200:
Report of the Chairman of the Board
- Page 201 and 202:
The business lines carry out their
- Page 203 and 204:
5. Actions undertaken to strengthen
- Page 205 and 206:
Report of the Vice-Chairman and Sen
- Page 207 and 208:
Consolidated financial statements T
- Page 209 and 210:
Consolidated financial statements K
- Page 211 and 212:
Consolidated balance sheet Equity a
- Page 213 and 214:
Consolidated statement of changes i
- Page 215 and 216:
2. Consolidation methods 2.1 Consol
- Page 217 and 218:
3.1.3 Measurement of share-based pa
- Page 219 and 220:
3.6.3 Group savings plans In France
- Page 221 and 222:
3.18 Impairment of non-financial no
- Page 223 and 224:
For defined benefit plans, the expe
- Page 225 and 226:
4.1 Consolidated income statement (
- Page 227 and 228:
4.4 Consolidated cash flow statemen
- Page 229 and 230:
ANA’s contribution to VINCI’s 2
- Page 231 and 232:
2. Other information by business li
- Page 233 and 234:
Reconciliation between capital empl
- Page 235 and 236:
4. Capital employed by geographical
- Page 237 and 238:
(in € millions) Cost of net finan
- Page 239 and 240:
8. Earnings per share Basic earning
- Page 241 and 242:
10. Goodwill Changes in the period
- Page 243 and 244:
12. Property, plant and equipment (
- Page 245 and 246:
14. Investments in companies accoun
- Page 247 and 248:
The fair value of non-current deriv
- Page 249 and 250:
17.1 Share capital At 31 December 2
- Page 251 and 252:
The Shareholders’ Ordinary Genera
- Page 253 and 254:
Fair value of the performance share
- Page 255 and 256:
The retirement benefit obligations
- Page 257 and 258:
VINCI estimates the payments to be
- Page 259 and 260:
Employee training rights The French
- Page 261 and 262:
21. Net financial debt At 31 Decemb
- Page 263 and 264:
Details of the Group’s main finan
- Page 265 and 266:
21.2.2 Net cash managed Net cash ma
- Page 267 and 268:
22. Financial risk management VINCI
- Page 269 and 270:
The following table shows the perio
- Page 271 and 272:
22.3.4 Analysis of foreign currency
- Page 273 and 274:
31/12/2012 Accounting categories (1
- Page 275 and 276:
Control and regulation of prices by
- Page 277 and 278:
26. Concession and PPP contracts of
- Page 279 and 280:
28. Contractual obligations and oth
- Page 281 and 282:
ˇˇEurovia CS, a subsidiary of Eur
- Page 283 and 284:
J. List of the main consolidated co
- Page 285 and 286:
31 December 2013 31 December 2012 C
- Page 287 and 288:
31 December 2013 31 December 2012 C
- Page 289 and 290:
31 December 2013 31 December 2012 C
- Page 291 and 292:
3. Specific verification We have al
- Page 293 and 294:
Income statement (in € millions)
- Page 295 and 296:
Cash flow statement (in € million
- Page 297 and 298:
Depreciation is calculated on a str
- Page 299 and 300:
2. Financial assets Gross values (i
- Page 301 and 302:
Issues of shares during the period
- Page 303 and 304:
Liabilities at 31 December 2013 (in
- Page 305 and 306:
Other receivables 140 Cash manageme
- Page 307 and 308:
Five-year financial summary 2009 20
- Page 309 and 310:
Special report of the Statutory Aud
- Page 311 and 312:
2. Agreements and commitments appro
- Page 313 and 314:
4. Information incorporated by refe
- Page 315:
11. Research and development, paten
- Page 318:
In accordance with Article 212-13 o