

Daniel l. Rubinfeld
Daniel l. Rubinfeld
Daniel l. Rubinfeld

Create successful ePaper yourself
Turn your PDF publications into a flip-book with our unique Google optimized e-Paper software.
168 Part 2 Producers, Consumers, and Competitive Markets<br />
5 Choice Under Uncertainty 69<br />
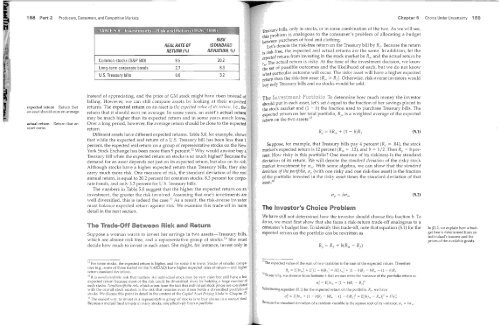
Common stocks (S&P 500)<br />
Long-term corporate bonds<br />
U.S. Treasury bills<br />
REAL RATE OF<br />
RETURN(%)<br />
9.5<br />
2.7<br />
0.6<br />
RiSK<br />
(STANDARD<br />
DEVIATION, %)<br />
20.2<br />
8.3<br />
3.2<br />
Treasury bills, only in stocks, or in some combination of the h\'o. As we will see,<br />
this problem is analogous to the co.nsumer's problem of allocating a budget<br />
betw'een purchases of food and clothmg.<br />
Let's denote the risk-free return on the Treasury bill by Rr. Because the rehlrn<br />
's risk free, the expected and actual returns are the same, In addition, let the<br />
~xpected return from investing in the stock market be RIJI and the actual rehm1 be<br />
l' The achlal rehlrn is risky At the time of the investment decision, we know<br />
th~ set of possible outcomes and the likelihood of each, but we do not know<br />
what particular outcome will occur, The risky asset will have a higher expected<br />
return than the risk-free asset (RIJI > Rr). Otherwise, risk-averse investors \\'ould<br />
buy only Treasury bills and no stocks would be sold.<br />
expected return Return that<br />
an asset should earn on a\'erage<br />
actual return Return that an<br />
asset earns,<br />
instead of appreciating, and the price of GM stock might ha\'e risen instead of<br />
falling. Howe\'er, we can still compare assets by looking at their expected<br />
returns. The expected return on an asset is the expected ('ollie of its tetl/m, i.e., the<br />
return that it should earn on average, In some years, an asset's actual return<br />
may be much higher than its expected return and in some years much lower.<br />
Over a long period, howe\'er, the average return should be close to the expected<br />
return.<br />
Different assets ha\'e different expected rehlrns. Table 5.8, for example, shows<br />
that while the expected real return of a U.s. Treasury bill has been less than 1<br />
percent, the expected real return on a group of representative stocks on the New<br />
York Stock Exchange has been more than 9 percentY Why \·vould anyone buy a<br />
Treasury bill when the expected return on stocks is so much higher Because the<br />
demand for an asset depends not just on its expected return, but also on its risk:<br />
Although stocks have a higher expected return than Treasury bills, they also<br />
carry much more risk. One measure of risk, the standard deviation of the real<br />
annual return, is equal to 202 percent for com,mon stocks, 8.3 percent for corporate<br />
bonds, and only 3.2 percent for u.s. Treasury bills.<br />
The numbers in Table 5.8 suggest that the higher the expected return on an<br />
im'estment, the greater the risk ilwolved. Assuming that one's irwestments are<br />
well di\'ersified, this is indeed the case. 13 As a result, the risk-averse im'estor<br />
must balance expected return against risk, We examine this trade-off in more<br />
detail in the next section,<br />
and Return<br />
Suppose a woman wants to im'est her savings in two assets-Treasury bills,<br />
vvhich are almost risk free, and a representative group of stocks.l~ She must<br />
decide how much to invest in each asset. She might, for instance, invest only in<br />
To determine how much money the investor<br />
should put in each asset, let's set b equal to the fraction of her savings placed in<br />
the stock market and (1 - b) the fraction used to purchase Treasury bills. The<br />
expected return on her to_tal portfolio, R,,, is a weighted average of the expected<br />
return on the two assets: b (5.1)<br />
Suppose, for example, that Treasury bills pay 4 percent (R r = .04), the stock<br />
market's expected return is 12 percent (RIJI = ,12), and b = l/i Then Rp = 8 percent.<br />
How risky is this portfolio One measure of its riskiness is the standard<br />
deviation of its return. We will denote the stillldord deviotioll of the risky stock<br />
market investment by CTIJI' With some algebra, we can show that the stoHdord<br />
deviotioll of the portfolio, CT p (with one risky and one risk-free asset) is the fraction<br />
of the portfolio invested in the risky asset times the standard deviation of that<br />
asset: 16<br />
The investor's Choice Problem<br />
(5.2)<br />
We have still not determined how the investor should choose this fraction b. To<br />
do so, we must first show that she faces a risk-rehlrn trade-off analogous to a<br />
consumer's budget line, To identify this trade-off, note that equation (5.1) for the<br />
expected rehlrn on the portfolio can be rewritten as<br />
In §3.2, we explain how a budget<br />
line is determined from an<br />
individual's income and the<br />
prices of the available goods.<br />
12 For some stocks, the expected return is higher, and for some it is lower. Stocks of smaller companies<br />
(e,g, some of those traded on the NASDAQ) ha\'e higher expected rates of return-and higher<br />
return standard de\'iations.<br />
13 It is lIolldil'crsifiablc risk that matters. An indi\'idual stock may be \'en' risk\' but still ha\'e a low<br />
expected return' because most of the risk could be dh'ersified ~,,'ay by'holdi;1g a large number of<br />
such stocks. Z\olldil'crsifiablc risk, which arises from the fact that indi\'idual stock prices are correlated<br />
with the o\'erall stock market, is the risk that remains e\'en if one holds a diversified portfolio of<br />
stocks. We discuss this point in detail in the context of the Capital Asset Pricillg ivIodd in Chapter Ii<br />
14The easiest way to im'est in a representati\'e group of stocks is to buy shares in a IlIlItllll! flilld,<br />
Because a mutual fund invests in many stocks, one effecti\'ely buys a portfolio.<br />
15 The expected value of the sum of two variables is the sum of the expected values Therefore<br />
R" = E[bl'",l + E[(l - b)Rrl = bE[r",] + (1<br />
~' ,<br />
b)Rr<br />
.<br />
l1R" (1 b)R. ,<br />
To see why, we observe from footnote 4 that we can write the variance of the portfolio return as<br />
u~ = E[br", + (1 - b)Rr R,,<br />
Substituting equation (5,1) for the expected return on the portfolio, R", we ha\'e<br />
up E[bl'", + (1 - b)Rj - bR", (1 b)Rrf E[b(r" - Rm)f = b 2 u;,<br />
Because the standard deviation of a random variable is the square root of its \'ariance, u"<br />
bu""


