

Daniel l. Rubinfeld
Daniel l. Rubinfeld
Daniel l. Rubinfeld

You also want an ePaper? Increase the reach of your titles
YUMPU automatically turns print PDFs into web optimized ePapers that Google loves.
22 Introduction: Markets and Prices<br />
2 Tile Basics of Supply and Demand 23<br />
Price<br />
o<br />
Quantity<br />
0'<br />
thc pricc of ilill III ill II liZ incrcoscs. Likewise, beef and chicken are substitute goods<br />
because most consumers are willing to shift their purchases from one to the<br />
other -when prices change.<br />
Goods are complements when an increase in the price of one leads to a<br />
decrease in the quantity demanded of the other. For example, automobiles and<br />
gasoline are complementary goods. Because they tend to be used together, a<br />
decrease in the price of gasoline increases the quantity demanded for automobiles.<br />
Likewise, computers and computer software are complementary goods. TIle price<br />
of computers has dropped dramatically over the past decade, fueling an increase<br />
not only in purchases of computers, but also purchases of sofhYare packages.<br />
We attributed the shift to the right of the demand curve in Figure 2.2 to an<br />
increase in income. However, this shift could also have resulted from either an<br />
increase in the price of a substihlte good or a decrease in the price of a complementary<br />
good. Or it might have resulted from a change in some other variable,<br />
such as the ·weather. For example, demand curves for skis and snovvboards vvill<br />
shift to the right when there are heavy snowfalls.<br />
complements Two goods for<br />
which an increase in the price<br />
of one leads to a decrease in<br />
the quantity demanded of the<br />
other.<br />
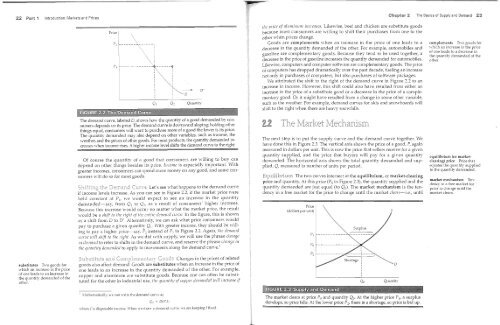
TIle demand curve, labeled D, shows how the quantity of a good demanded by consumers<br />
depends on its price. The demand curve is downward sloping; holding other<br />
things equal, consumers will want to purchase more of a good the lower is its price.<br />
TIle quantity demanded may also depend on other variables, such as income, the<br />
weather, and the prices of other For most products, the quantity demanded increases<br />
'when income rises. A income level shifts the demand cmve to the right.<br />
Of course the quantity of a good that consumers are ·willing to buy can<br />
depend on other things besides its price. IIlCOIllC is especially important. With<br />
OTeater incomes consumers can spend more money on any good, and SOIne cont)<br />
/ .. .. \....I<br />
SUlners will do so for most goods.<br />
Let's see what happens to the demand curve<br />
increase. As you can see in Figure 2.2, if the market price were<br />
held constant at PI' we would expect to see an increase in the quantity<br />
demanded-sa\', from Ql to Q2' as a result of consumers' higher incomes.<br />
Because this in~rease would occur no matter vyhat the market price, the result<br />
would be a slzift to tlzc riolzt of tlzc ciltirc dClIlilnd ClltIlC. In the figure, this is shown<br />
. u.<br />
as a shift from D to D' Alternativel\', we can ask what price consumers would<br />
pay to purchase a gi\-en quantity Q;. With greater income, they should be willino<br />
to pav a hiaher price-sa\" P2 instead of P! in Figure 2.2. Again, thc dClI/illld<br />
o _ 0 _<br />
CllrIlC will slz{ft to tlzc riglzt_ As we did with supply, we ,,,,ill use the phrase ClzilllgC<br />
ill dClllilnd to refer to shifts in the demand curve, and reserve the phrase clzmzgc ill<br />
tlzc qUillltity dClIlilndcd to apply to mo\-ements along the demand curve.!<br />
The next step is to put the supply curve and the demand curve together. We<br />
have done this in Figure 2.3. The vertical axis shows the price of a good, P, again<br />
measured in dollars per unit. This is now the price that sellers receive for a given<br />
quantity supplied, and the price that buyers ·will pay for a given quantity<br />
demanded. The horizontal axis shows the total quantity demanded and supplied,<br />
Q, measured in number of lmits per period.<br />
The hvo curves intersect at the equilibrium, or market-clearing<br />
and quantity. At this price (Po in Figure 23), the quantity supplied and the<br />
quantity demanded are just equal (to Qo). The market mechanism is the tendency<br />
in a free market for the price to change until the market cleilrs-i.e., until<br />
%&&<br />
Price<br />
(dollars per unit)<br />
equilibrium (or marketclearing)<br />
price Price that<br />
equates the quantity supplied<br />
to the quantity demanded.<br />
market mechanism Tendenc\,<br />
in a free market for<br />
price'to change until the<br />
market clears.<br />
substitutes Two goods for<br />
which an increase in the price<br />
of one leads to an increase in<br />
the quantity demanded of the<br />
other.<br />
Changes in the prices of related<br />
goods also affect Goods are substitutes when an increase in the price of<br />
one leads to an increase in the quantity demanded of the other. For example,<br />
copper and aluminum are substitute goods. Because one can often be substituted<br />
for the other in industrial use, tlzc qUillltity L:f coppcr dClllillldcd will incrcilsc if<br />
o<br />
Quantity<br />
1 :vlathematicalh-, \\-e can write the demand cun-e as<br />
where I is disposable income. When we dra\\- a demand curve, \\-e are keeping I fixed.<br />
The market clears at price Po and quantity Qo. At the higher price PI' a surplus<br />
(i,,ln,-"" so falls. At the lower P 2 , there is a is bid


