

Daniel l. Rubinfeld
Daniel l. Rubinfeld
Daniel l. Rubinfeld

You also want an ePaper? Increase the reach of your titles
YUMPU automatically turns print PDFs into web optimized ePapers that Google loves.
Introduction: Markets and Prices<br />
2 The Basics of Supply and Demand<br />
Price<br />
i§§<br />
&<br />
5 5'<br />
(1970<br />
dollars<br />
per<br />
dozen)<br />
p<br />
M<br />
(arumal<br />
costin<br />
1970<br />
dollars)<br />
p<br />
-!573<br />
5061<br />
2530<br />
0'<br />
5025<br />
Quantity<br />
Supply and demand curves shift over time as market conditions ch~nge. Ir: this<br />
example, rightw'ard shifts of the supply and demand curves lead to a slIghtly lugher<br />
price and a much larger quantity. In general, in price and quantity depend<br />
amount which each CUIve shifts and the of each cun'e.<br />
with changing tastes. Similarly wage rates, capital costs, and the prices of rayv<br />
materials also change from time to time, and these changes shift the supply CLUTe,<br />
Supply and demand curves can be used to trace the effects of these changes.<br />
In Figure 2.6, for example, shifts to the right of both supply and demand result<br />
in a slightly higher price (from P J to P 2 ) and a much larger quantity (from QJ to<br />
Q2)' In general, price and quantity will change depending both on how much t~1e<br />
supply and demand curves shift and on the shapes of those curves .. To predl~t<br />
the sizes and directions of such changes, we must be able to charactenze quantltatively<br />
the dependence of supply and demand on price and other variables. We<br />
will turn to this task in the next sectiOIL<br />
01970<br />
O 1998<br />
5300 5500 Q 7A 12..3 Q<br />
(million dozens)<br />
(millions of students enrolled)<br />
(a)<br />
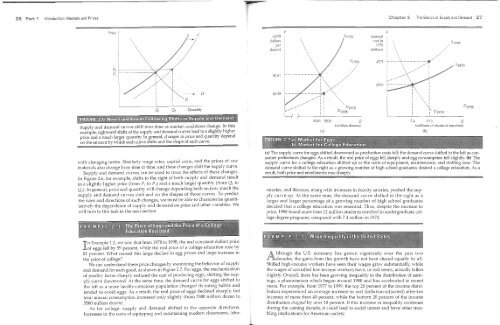
(a) The supply curve for eggs shifted downward as production costs fell; the demand cunre shifted to the left as consumer<br />
preferences changed. As a result, the real price of eggs fell sharply and egg consumption fell slightly. (b) The<br />
supply curve for a college education shifted up as the costs of equipment, maintenance, and staffing rose. The<br />
demand curve shifted to the right as a mm1ber of high school graduates desired a college education. As a<br />
result, both price and enrollments rose<br />
ratories, and libraries, along with increases in faculty salaries, pushed the supply<br />
curve up. At the same time, the demand curve shifted to the right as a<br />
larger and larger percentage of a growing number of high school graduates<br />
decided that a college education was essential. Thus, despite the increase in<br />
price, 1998 found more than 12 million students enrolled in undergraduate college<br />
degree programs, compared with 7.4 million in 1970.<br />
(b)<br />
it<br />
Example 1.2, we saw that from 1970 to 1998, the real (constant-dollar) price<br />
eaas fell bv 59 percent, while the real price of a college education rose by<br />
00 - d l' .<br />
81 percent What caused this large decline in egg prices an arge mcrease m<br />
the price of college .<br />
We can understand these price changes by examining the behavior ot supply<br />
and demand for each good, as shown in Figure 2]. For eggs, the mechanization<br />
of poultry farms sharply reduced the cost of producing eggs, shifting tl:le supply<br />
curve dovmward. At the same time, the demand curve for eggs shifted to<br />
the left as a more health-conscious population changed its eating habits and<br />
tended to avoid eggs. As a result, the real price of eggs declined sharply, but<br />
total annual consumption increased only slightly (from 5300 million dozen to<br />
5500 million dozen).<br />
As for colleae o ' supply _ and demand shifted in the opposite directions.<br />
Increases in the costs of equipping and maintaining modern classrooms, labo-<br />
lthough the U.s. economy has grown vigorously over the past two<br />
decades, the gains from this growth have not been shared equally by alL<br />
Skilled high-income workers have seen their wages grow substantially, while<br />
the wages of l.U1skilled low-income workers have, in real terms, actually fallen<br />
slightly. Overall, there has been growing inequality in the distl'ibution of earnings,<br />
a phenomenon which began around 1980 and has accelerated in recent<br />
years. For example, from 1977 to 1999, the top 20 percent of the income distribution<br />
experienced an average increase in real (inflation-adjusted) after-tax<br />
incomes of more than 40 percent, while the bottom 20 percent of the income<br />
distribution dropped by over 10 percent. If this increase in inequality continues<br />
during the coming decade, it could lead to social unrest and have other troubling<br />
implications for American society.


