

Daniel l. Rubinfeld
Daniel l. Rubinfeld
Daniel l. Rubinfeld

You also want an ePaper? Increase the reach of your titles
YUMPU automatically turns print PDFs into web optimized ePapers that Google loves.
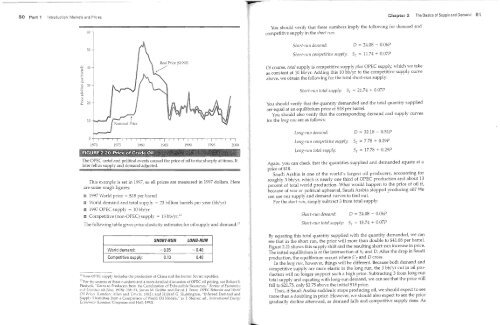
50 Part 1 Introduction: Markets and Prices<br />
f<br />
.~---------------------------------------------------------------------------=---,<br />
2 The Basics of Supply and Demand 51<br />
60<br />
ci<br />
M§%§ff<br />
&±±<br />
¥<br />
Piifi¥<br />
You should verify that these numbers imply the following for demand and<br />
competitive supply in the short rllI1:<br />
30<br />
Slzort-rlill demand: o = 24.08 - 0.06P<br />
Short-run competitive supply: Sc = 11.74 + 0.07P<br />
~ 40<br />
.!::. "<br />
:;<br />
c...<br />
t 30<br />
~<br />
'-'<br />
Of course, total supply is competitive supply plus OPEC supply, which we take<br />
as constant at 10 bb/yr. Adding this 10 bb/yr to the competitive supply curve<br />
above, we obtain the following for the total short-nm supply:<br />
SllOrt-rilIl total supply: ST = 21.74 + 0,07P<br />
10.".,,_-<br />
You should verify that the quantity demanded and the total quantity supplied<br />
are equal at an equilibrium price of $18 per barrel.<br />
You should also verify that the corresponding demand and supply curves<br />
for the long I'lln are as follows:<br />
I<br />
I I<br />
1975<br />
I I I I I<br />
1980<br />
I I I I I I I<br />
1985<br />
I I I I I I I I I I<br />
1990 1995<br />
I<br />
I<br />
2000<br />
Long-rull demand:<br />
Long-ntn competitive supply:<br />
Long-rull total supply:<br />
o = 32.18 0.51P<br />
Sc = 7.78 + 0.29P<br />
ST = 17.78 + 0.29P<br />
The OPEC cartel and political events caused the price of oil to rise sharply at times. It<br />
later fell as supply and demand adjusted.<br />
This example is set in 1997, so all prices are measured in 1997 dollars. Here<br />
are some rough figures:<br />
• 1997 World price<br />
S18 per barrel<br />
• World demand and total supply = 23 billion barrels per year (bb/yr)<br />
• 1997 OPEC supply = 10 bb/yr<br />
• Competiti\'e (non-OPEC) supply = 13 bb/yr.l2<br />
The following table giyes price elasticity estimates for oil supply and demandY<br />
SHORT-RUN<br />
LONG-RUN<br />
World demand: -0.05 - 0.40<br />
Competitive supply: 0.10 0.40<br />
lc:\on-OPEC supply includes the production of China and the fonner SO\'iet republics_<br />
13 For the ~~urces of these numbers and a more detailed discussion of OPEC oil pricing, see Robert S,<br />
Pmdyck. Cams to Producers from the Cartelization of Exhaustible Resources," Rel'iew or Eco/lolllics<br />
aild Statlsilcs 60 (\!a~ 1978): 238-51; James:vI Griffin and Da\"id J. Teece, OPEC Beilllc'io;' and World<br />
Oil Prices (London: Allen and Cnwin, 1982); and Hillard G Huntinaton, "Inferred Demand and<br />
Supply Elasticities from a Comparison of World Oil Models," in T St~rner, ed, Intemational E/lewll<br />
Ecollomic:' (London: Chapman and Hall, 1992)<br />
LV<br />
Again, you can check that the quantities supplied and demanded equate at a<br />
price of $18.<br />
Saudi Arabia is one of the ,'>'orId's largest oil producers, accounting for<br />
roughly 3 bb/yr, which is nearly one third of OPEC production and about 13<br />
percent of total world production. What would happen to the price of oil if,<br />
because of war or political upheaval, Saudi Arabia stopped producing oil We<br />
can use our supply and demand curves to find out.<br />
For the short lUll, simply subtract 3 from total supply:<br />
SllOrt-rllll demand: o = 24.08 0.06P<br />
SllOrt-nlll total supply: Sr = 18.74 + 0,07P<br />
By equating this total quantity supplied with the quantity demanded, we can<br />
see that in the short nm, the price will more than double to $41.08 per barrel.<br />
Figure 2.21 shows this supply shift and the resulting short-nm increase in price.<br />
The initial equilibrium is at the intersection of ST and D. After the drop in Saudi<br />
production, the equilibrium occurs where S' T and 0 cross.<br />
In the long I'UI1, however, things will be different. Because both demand and<br />
competitive supply are more elastic in the long run, the 3 bb/yr cut in oil production<br />
will no longer support such a high price. Subtracting 3 from long-run<br />
total supply and equating with long-run demand, we can see that the price will<br />
fall to $21.75, only $3.75 above the initial $18 price.<br />
Thus, if Saudi Arabia suddenly stops producing oil, we should expect to see<br />
more than a doubling in price. However, we should also expect to see the price<br />
gradually decline afterw"ard, as demand falls and competitive supply rises, As


