Daniel l. Rubinfeld
Daniel l. Rubinfeld
Daniel l. Rubinfeld
You also want an ePaper? Increase the reach of your titles
YUMPU automatically turns print PDFs into web optimized ePapers that Google loves.
64 Part 2 Producers, Consumers, and Competitive Markets<br />
Cadillac and a Cadillac to a Chevrolet, then a Porsche is also preferred to a<br />
Chevrolet. Transiti\'ity is normally regarded as necessary for consumer<br />
consistency.<br />
3. More is better than less: Goods are assumed to be desirable-Le., to be good.<br />
Consequently, cOllsumers always prefer 1lI0re of allY good to less. In addition,<br />
consumers are never satisfied or satiated; 1lI0re is always better, eve11 if just il<br />
little better. 1 This assumption is made for pedagogic reasons; namely, it simplifies<br />
the graphical analysis. Of course, some goods, such as air pollution,<br />
may be tmdesirable, and consumers ,,,,ill always prefer less. We ignore these<br />
"bads" in the context of our immediate discussion of consum.er choice<br />
because most consumers v>'Quld not choose to purchase them. We will, hOlYever,<br />
discuss them later in the chapter.<br />
These three assumptions form the basis of consumer theory. They do not explain<br />
consumer preferences, but they do impose a degree of rationality and reasonableness<br />
on them. Building on these assumptions, we ·",vill no,v explore consumer<br />
behavior in greater detail.<br />
Clothing I<br />
(units per week)<br />
50<br />
40<br />
30<br />
20<br />
10<br />
%JeG<br />
A e<br />
L-----:1~0---L20---:--3J-0---4LO-<br />
Mr&<br />
Food<br />
(units per week)<br />
..<br />
indifference curve Curve<br />
representing all combinations<br />
of market baskets that provide<br />
a consumer with the same<br />
level of satisfaction.<br />
Indifference Curves<br />
We can show a consumer's preferences graphically with the use of illdifference<br />
curves. An indifference curve represe11ts all cOllIbillatiolls of llIarket baskets that provide<br />
a perso11 with the sallie level of sa tisfactioll That person is therefore illd~fferellt<br />
among the market baskets represented by the points graphed on the curve.<br />
Given our three assumptions about preferences, we know that a consumer<br />
can ahvays indicate either a preference for one market basket over another or<br />
indifference between the two. We can then use this information to rank all possible<br />
consumption choices. In order to appreciate this principle in graphic form,<br />
let's assume that there are only hvo goods available for consumption: food F and<br />
clothing C In this case, all market baskets describe combinations of food and<br />
clothing that a person might ·wish to consume. As vve have already seen, Table 3.1<br />
provides some examples of baskets containing various amounts of food and<br />
clothing.<br />
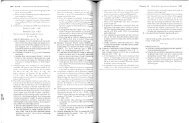
In order to graph a consumer's indifference curve, it helps first to graph his<br />
or her individual preferences. Figure 3.1 shows the same baskets listed in Table<br />
3.1. The horizontal axis measures the number of units of food purchased each<br />
week; the vertical axis measures the number of units of clothing. Market basket<br />
A, with 20 units of food and 30 units of clothing, is preferred to basket G<br />
because A contains more food a11d more clothing (recall our third assumption<br />
that more is better than less). Similarly, market basket E, which contains even<br />
more food and even more clothing, is preferred to A In fact, ,'\'e can easily compare<br />
all market baskets in the hvo shaded areas (such as E and G) to A because<br />
they all contain either more or less of both food and clothing. Note, however,<br />
that B contains more clothing but less food than A Likewise, D contains more<br />
food but less clothing than A Therefore, comparisons of market basket A with<br />
baskets B, D, and H are not possible ·without more information about the consumer's<br />
ranking.<br />
TIus additional information is provided in Figure 3.2, which shows an indifference<br />
curve, labeled U 1<br />
, that passes through points A, B, and D. This CUlTe<br />
indicates that the consumer is indifferent among these three market baskets. It<br />
1 Thus some economists use the term 1l0llSiltilltioll to refer to this third assumption<br />
Because more of each good is preferred to less, we can compare market baskets in<br />
the shaded areas. Basket A is clearly preferred to basket G, while E is clearly preferred<br />
to A However, A cannot be compared with B, D, or H without additional<br />
informa tion.<br />
Clothing<br />
(units per week)<br />
50 ------ B<br />
40<br />
30<br />
20<br />
10<br />
10 20 30 40 Food<br />
(units per week)<br />
The indifference curve U 1 that passes through market basket A shows all baskets that<br />
give the consumer the same level of satisfaction as does market basket A- these<br />
include baskets Band D. Om consumer basket E, which lies above zi, to A,<br />
but A to H or which lie below<br />
65


