

Daniel l. Rubinfeld
Daniel l. Rubinfeld
Daniel l. Rubinfeld

You also want an ePaper? Increase the reach of your titles
YUMPU automatically turns print PDFs into web optimized ePapers that Google loves.
288 Part 2 Producers, Consumers, and Competitive Markets<br />
Chapter 9 The Analysis of Competitive Markets 289<br />
Consumer<br />
. Surplus<br />
In §2.7, we explain that under<br />
price controls, the price of a<br />
product can be no higher<br />
than a maximum allowable<br />
ceiling price.<br />
For a review of consumer surplus,<br />
see §4.4, where it is<br />
defined as the difference<br />
between what a consumer is<br />
willing to pay for a good and<br />
what the consumer actually<br />
pays when buying it<br />
We saw at the end of Chapter 2 that a goyenunent-imposed price ceiling causes<br />
the quantity of a good demanded to rise. (at the lO'wer price, con~u~11ers want to<br />
buy more) and the quantity supplied to tall (producers a~e not 'Nlllmg to SUPply<br />
as much at the lower price). The result is a shortage-Le., excess demand.Of\<br />
course, those consumers who can still buy the good yvill be better off because<br />
they ,,>rill now pay less. (Presumably, this was the objective of the ~olicy in the<br />
first place.) But if we also take into account those who Calmot obtam ~he good,<br />
how much better off are consumers as a whole Might they be worse ot£ And if<br />
we lump consumers and producers together, will their total welfare be greater or<br />
lower and by how much To answer questions such as these, we need a way to<br />
meas~re the 'gains and losses from govenunent interventions and the changes in<br />
market price and quantity that such interventions cause.<br />
Our method is to calculate the changes in COIlSllIller alld prodllcer surplus<br />
result from an intervention. In Chapter 4, we saw that consumer sllrpills<br />
the aaareaate net benefit that consumers obtain from a competitive market.<br />
Chap~~r 8~ we saw how producer surpills measures the aggregate net benefi~ .<br />
producers. Here we will see how consumer and producer surplus can be applied<br />
in practice.<br />
Review of Consumer and Producer Surplus<br />
In an unregulated, competiti\·e market, consumers and producers buy and seU<br />
at the prevailing market price. But rernember, for some consumers tl:e value of<br />
the good e:rceeds this market price; they would pay more for the good.if they had<br />
to. CO/lSlllller surpills is the total benefit or value that consumers receive beyond<br />
what they pay for the good. . . .<br />
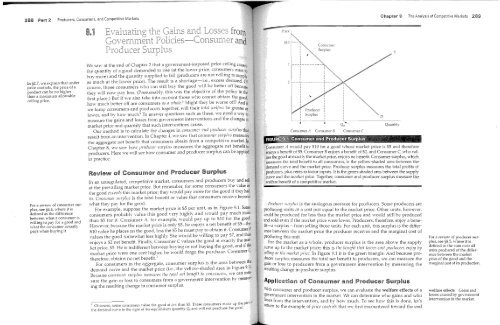
For example, suppose the market price is $5 per umt, as m FIgure 9.1. Some<br />
consumers probably value this good \·ery highly and would pa)~ much more<br />
than $5 for it. Consumer A, for example, would pay up to $10 tor the good.<br />
However, because the market price is only $5, he enjoys a net benefit of $5-the<br />
510 value he places on the good, less the $5 he must pay. t~ obtain it. C~nsumer B<br />
values the good somewhat less highly. She would be wl11mg to pay $1, and thus<br />
enjoys a 52 net benefit. Finally, Consumer C values the g~od at exactly the .market<br />
price, $5. He is indifferent ~ehveen buying or not buymg the good, and If th;<br />
market price were one cent hIgher, he would forgo the purchase. Consumer ,<br />
therefore, obtains no net benefit. 1<br />
th<br />
For consumers in the aaareaate, consumer surplus is the area between e<br />
00<br />
demand curve and the market<br />
old<br />
price (i.e., the yellow-s 1a e<br />
d<br />
area m<br />
. F'<br />
Igure<br />
91)<br />
..<br />
Because CO/lSllmer surpills lIleasures the total /let benefit to consumers, we can measure<br />
the gain or loss to consumers from a govenunent intervention by measuring<br />
the resulting change in consumer surplus.<br />
1 Of course, some consumers \'alue the good at less than 55. These consumers make up the part<br />
the demand cun'e to the right of the equilibrium quantity Qo and v.'111 not purchase the good.<br />
Quantity<br />
Consumer A would pay $10 for a good whose market price is $5 and therefore<br />
enjoys a benefit of $5. Consumer B enjoys a benefit of $2, and Consumer C, who values<br />
the good at exactly the market price, enjoys no benefit. Consumer surplus, which<br />
measures the total benefit to all consumers, is the yellow-shaded area between the<br />
demand curve and the market price. Producer surplus measures the total profits of<br />
producers, plus rents to factor inputs. It is the green-shaded area between the supply<br />
curve and the market price. Togetl1er, consumer and producer surplus measure the<br />
welfare benefit of a competitive market.<br />
Prodllcer sllrplus is the analogous measure for producers. Some producers are<br />
producing units at a cost just equal to the market price. Other units, however,<br />
could be produced for less than the market price and would still be produced<br />
and sold e\'en if the market price 'were lower. Producers, therefore, enjoy a benefit-a<br />
surplus-from selling those units. For each unit, this surplus is the difference<br />
between the market price the producer receives and the marginal cost of<br />
producing this unit.<br />
For the market as a whole, producer surplus is the area above the supply<br />
curve up to the market price; this is the bell~fit that lower-cost producers elljoy by<br />
selling at the lIlarket price. In Figure 9.1 it is the green h·iangle. And because producer<br />
surplus measures the total net benefit to producers, we can measure the<br />
gain or loss to producers from a government intervention by measuring the<br />
resulting change in producer surplus.<br />
Application of Consumer and Producer Surplus<br />
With consumer and producer surplus, \ye can evaluate the welfare effects of a<br />
government inten'ention in the market. We can determine who gains and who<br />
loses from the intervention, and bv how much. To see how this is done, let's<br />
return to the example of price colltr~ls that we first encountered toward the end<br />
For a review of producer surplus,<br />
see §S.5, where it is<br />
defined as the sum over all<br />
units produced of the difference<br />
behveen the market<br />
price of the good and the<br />
marginal cost of its production.<br />
welfare effects Gains and<br />
losses caused by government<br />
intervention in the market


