Daniel l. Rubinfeld
Daniel l. Rubinfeld
Daniel l. Rubinfeld
Create successful ePaper yourself
Turn your PDF publications into a flip-book with our unique Google optimized e-Paper software.
18 Part 1 Introduction: Markets and Prices<br />
5. Suppose that the Japanese yen rises against the US<br />
dollar; that is, it will take more dollars to buy any<br />
given amount of Japanese yen" Explain why this<br />
increase simultaneously increases the real price of<br />
Japanese cars for US consumers and lowers the real<br />
price of US automobiles for Japanese consumers<br />
6. The price of long-distance telephone service fell from<br />
-loO cents per minute in 1996 to 22 cents per minute in<br />
1999, a -loS-percent (18 cents/-±O cents) decrease" The<br />
Consumer Price Index increased by 10 percent over<br />
this period. What happened to the real price of telephone<br />
service<br />
1. Decide whether each of the following statements is<br />
true or false and explain why:<br />
a. Fast-food chains like McDonald's, Burger King,<br />
and Wendy's operate all over the United States.<br />
Therefore the market for fast food is a national<br />
market.<br />
b. People generally buy clothing in the city in which<br />
they live. Therefore there is a clothing market in,<br />
say, Atlanta that is distinct from the clothing market<br />
in Los Angeles.<br />
c. Some consumers strongly prefer Pepsi and some<br />
strongly prefer Coke. Therefore there is no single<br />
market for colas"<br />
2. The following table shows the average retail price of<br />
milk and the Consumer Price Index from 1980 to 1998.<br />
1980 1985 1990 1995 1998<br />
CPI 100 130.58 158"62 184"95 197.82<br />
Retail price of milk S1.05 Sl.13 S139 Sl.48 S1.61<br />
(fresh, whole, 1/2 gaL)<br />
a. Calculate the real price of milk in 1980 dollars. Has<br />
the real price increased/decreased/stayed the same<br />
since 1980<br />
b. What is the percentage change in the real price<br />
(1980 dollars) from 1980 to 1998<br />
c. Convert the CPI into 1990 = 100 and determine<br />
the real price of milk in 1990 dollars.<br />
d. What is the percentage change in real price (1990<br />
dollars) from 1980 to 1998 Compare this with<br />
your answer in (b). What do you notice Explain.<br />
3. At the time this book went to print, the minimum<br />
wage was S5.15 .. To find the current value of the CPr,<br />
go to<br />
Click on Consumer<br />
Price Index-All Urban Consumers (Current<br />
Series) and select U.s. All items. This will give you the<br />
CPI from 1913 to the present<br />
a. With these values, calculate the current real minimum<br />
wage in 1990 dollars.<br />
b. What is the percentage change in the real minimum<br />
'wage from 1985 to the present, stated in real<br />
1990 dollars<br />
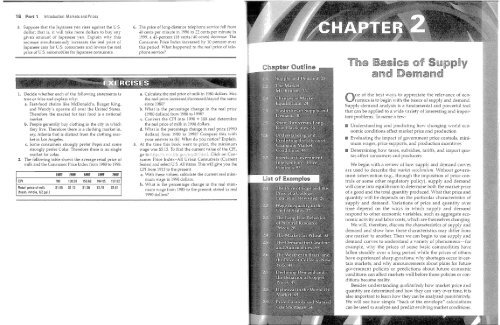
ne of the best ways to appreciate the relevance of economics<br />
is to begin with the basics of supply and demand"<br />
Supply-demand analysis is a fundamental and powerful tool<br />
that can be applied to a wide variety of interesting and important<br />
problems" To name a few:<br />
III Understanding and predicting how changing ·world economic<br />
conditions affect market price and production<br />
III Evaluating the impact of government price controls, minimum<br />
wages, price supports, and production incentives<br />
III Determining hm\' taxes, subsidies, tariffs, and import quotas<br />
affect consumers and producers<br />
We begin with a revie-w of hovv supply and demand curves<br />
are used to describe the lIlarket lIlechanislIl. Without government<br />
intervention (e.g., through the imposition of price controls<br />
or some other regulatory policy), supply and demand<br />
will come into equilibrium to determine both the market price<br />
of a good and the total quantity produced" What that price and<br />
quantity will be depends on the particular characteristics of<br />
supply and demand. Variations of price and quantity over<br />
time depend on the ways in which supply and demand<br />
respond to other economic variables, such as aggregate economic<br />
activity and labor costs, which are themselves changing"<br />
We will, therefore, discuss the characteristics of supply and<br />
demand and show how those characteristics may differ from<br />
one market to another. Then we can begin to use supply and<br />
demand curves to understand a variety of phenomena-for<br />
example, why the prices of some basic commodities have<br />
fallen steadily over a long period while the prices of others<br />
have experienced sharp gyrations; why shortages occur in certain<br />
markets; and vvhy armouncements about plans for fuhlre<br />
government policies or predictions about future economic<br />
conditions can affect markets well before those policies or conditions<br />
become reality.<br />
Besides understanding qllalitatively how market price and<br />
quantity are determined and how they can vary over time, it is<br />
also important to learn how they can be analyzed qllalltitatiuely.<br />
We will see hmv simple "back of the envelope" calculations<br />
can be used to analyze and predict evolving market conditions.


