

Daniel l. Rubinfeld
Daniel l. Rubinfeld
Daniel l. Rubinfeld

You also want an ePaper? Increase the reach of your titles
YUMPU automatically turns print PDFs into web optimized ePapers that Google loves.
66 Part 2 Producers, Consumers, and Competitive Markets<br />
tells us that in moving from market basket A to market basket B, the consumer<br />
feels neither better nor worse off in giving up 10 Ul1its of food to obtain 20 additional<br />
units of clothing. Likewise, the consumer is indifferent behveen points A<br />
and 0: He or she will give up 10 units of clothing to obtain 20 units of food. On<br />
the other hand, the consumer prefers A to H, which lies below LI 1 .<br />
Note that the indifference curve in Figure 3.2 slopes downward from left to<br />
right. To tmderstand why this must be the case, suppose instead that it sloped<br />
upward from A to E. This would violate the assumption that more of any commodity<br />
is preferred to less. Because market basket E has more of both food and<br />
clothing than market basket A, it must be preferred to A and therefore cannot be on<br />
the same indifference curve as A. In fact, any market basket lying above alld to tile<br />
right of indifference curve LII in Figure 3.2 is preferred to any market basket all LI 1 •<br />
,<br />
f<br />
(units per<br />
week)<br />
LI:<br />
Chapter :3 Consumer Behavior 67<br />
indifference map Graph<br />
containing a set of indifference<br />
curves showing the market<br />
baskets among which a consumer<br />
is indifferent<br />
Indifference Maps<br />
To describe a person's preferences for all combinations of food and clothing, \ve<br />
can graph a set of indifference curves called an indifference map. Each indifference<br />
curve in the map shows the market baskets among which the person is<br />
indifferent. Figure 3.3 shows three indifference curves that form part of an indifference<br />
map. Indifference curve LI3 generates the highest level of satisfaction, followed<br />
by indifference curves LI2 and LI 1 •<br />
Indiffer~nc:e curves cannot intersect. To see why, we will assume the contrary<br />
and see how the'iesurting graph-violates our assumptions about consumer<br />
behavior. Figure 3.4 shows hvo indifference curves, LII and LI 2 , that intersect at<br />
A. Because A and B are both on indifference curve LIlt the consumer must be<br />
indifferent behveen these hvo market baskets. Because both A and 0 lie on indifference<br />
curve LI 2 , the consumer must be indifferent behveen these market baskets.<br />
Consequently, the consumer must also be indifferent behveen Band D. But<br />
this conclusion can't be true: Market basket B must be preferred to 0 because it<br />
Clothing<br />
(units per<br />
week)<br />
Food<br />
(wlits per week)<br />
An indifference map is a set of indifference curves that describes a person's preferences.<br />
Any market basket on indifference curve U 3 , such as basket A, is preferred to<br />
any basket on curve LI2 (e.g., basket B), which in tum is preferred to any basket on<br />
such as D.<br />
Food<br />
(units per week)<br />
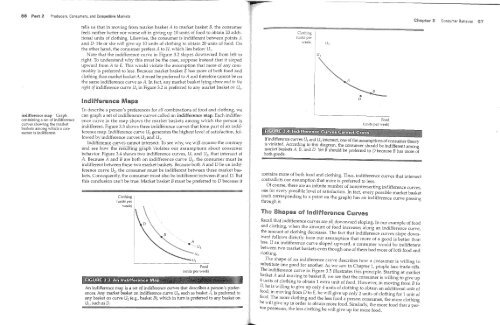
~f in.difference curv:s U1 and. U 2 ~tersect, one of the assumptions of consumer theory<br />
IS VIOlated. Accordmg to this diagram, the consumer should be indifferent among<br />
market baskets A, B, and n Yet B should be preferred to 0 because B has more of<br />
both goods.<br />
contains more of both food and clothing. Thus, indifference curves that intersect<br />
contradicts our assumption that more is preferred to less.<br />
O~ course, there.are an infinite number of nonintersecting indifference curves,<br />
one tor every possIble level of satisfaction. In fact, every possible market basket<br />
(each corresponding to a point on the graph) has an indifference curve passina<br />
tlu'ough it. 0<br />
The Shapes of Indifference Curves<br />
Recall tha~ indifference c\1rves are all downward sloping. In our example of food<br />
and clothmg, when the amount of food increases alona an indifference curve<br />
the amount of c.lothing. decreases. The fact that indiffere~ce curves slope down~<br />
ward follows dIrectly trom our assumption that more of a aood is better than<br />
less. If an indifference curve sloped up"vard, a consumer w~uld be indifferent<br />
between two market baskets e\"en though one of them had more of both food and<br />
clothing.<br />
Th.e shape of an indifference curve describes ho'w a consumer is willing to<br />
SUbS~Ihl.te one good for another. As we saw in Chapter I, people face trade-offs.<br />
The IndIfference c~lrve in Figure 3.5 illustrates this principle. Starting at market<br />
basket A and movmg to basket B, we see that the consumer is willina to aive up<br />
6 't f 1 l' '. 0 0<br />
Ul1l ~ 0 ~ ~t ung t obtam 1 extra UIllt of food. However, in moving from B to<br />
D, he IS vnllmg to gIve up only 4 units of clothina to obtain an additional unit of<br />
~OOd; in moving from 0 to E, he '\'ill give up onl)~ 2 units of clothing for Imut of<br />
ood .. n1~ more .clothing and the less food a person consumes, the more clothing<br />
he w1ll gl\'e up m order to o.btain m~re fod. Similarly, the more food that a person<br />
possesses, the less clotlung he WIll gIve up for more food.


