Daniel l. Rubinfeld
Daniel l. Rubinfeld
Daniel l. Rubinfeld
You also want an ePaper? Increase the reach of your titles
YUMPU automatically turns print PDFs into web optimized ePapers that Google loves.
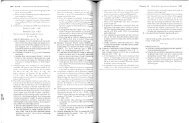
170 Part:2 Producers, Consumers, and Competitive Markets<br />
price of risk Extra risk that an<br />
investor must incur to enjoy a<br />
higher expected returno<br />
NOIV, from equation (502) we see that b<br />
a p / a llll so that<br />
(5.31 1<br />
This equation is a budget line because it describes<br />
the trade-off between risk (a p<br />
) and expected return (R;J Note thatit is the equation<br />
for a straight lin.e: Because R1I/! R f , and a lll<br />
are constants, the slope (Rill - R f )jam<br />
is a constant, as is the intercept Rto The equation says that the expected retul'll on<br />
the portfolio Rp increases as the stalliiard deviatioll of tl:at retltr!l a p increase~. We call<br />
the slope of this budget line, (RIll - Rt)/a lll , the pnce of ~lsk because It tells us<br />
how much extra risk an investor must incur to enjoy a hIgher expected return.<br />
The budget line is drawn in Figure 5.6. If our investor wants no risk, she can<br />
invest all her funds in Treasury bills (b = 0) and earn an expected rehlrn R f · To<br />
receive a higher expected return, she must incur some risk. For example, she<br />
could invest all her funds in stocks (b = 1), earning an expected return Rill but<br />
Expected<br />
Return, Rp<br />
. urrina a standard deviation all/' Or she might invest some fraction of her<br />
1l1C 0<br />
funds in each type of asset, earning an expected return somewhere between R f<br />
d R and facing a standard deviation less than alii<br />
an<br />
but greater than zero.<br />
III<br />
Figure 5.6 also shows the solution to the inrestor's<br />
problem. Three indifference curves are drawn in the figure. Each curve<br />
~escribes combinations of risk and return that leave the investor equally satisfied.<br />
The curves are up-ward-sloping because risk is undesirable. Thus with a greater<br />
amount of risk, it takes a greater expected return to make the investor equally<br />
well-off. The curve Ll3 yields the greatest amount of satisfaction and Ll1 the least<br />
amount: For a given amount of risk, the investor earns a higher expected return<br />
on U 3 than on Ll2' and a higher expected rehlrn on Ll2 than on Ll j •<br />
Of the three indifference curves, the investor °would prefer to be on Ll30 This<br />
position, however, is not feasible, because Ll3 does not touch the budget line.<br />
Curve U j is feasible, but the investor can do better. Like the consumer choosing<br />
quantities of food and clothing: our investo~' d~s best by cho~sing. a combin~tion<br />
of risk and return at the pomt ,,,rhere an mdifterence curve (m this case Ll 2 ) IS<br />
tangent to the budget line. At that point, the investor's return has an expected<br />
value R* and a standard deviation a*o<br />
Naturally, people differ in their attitudes toward risk This fact is illustrated in<br />
Fia-me 5.7, which shows how two different investors choose their portfolios.<br />
o<br />
5 Choice Under Uncertainty<br />
¥<br />
RUI ------------------------------<br />
Expected<br />
Return, Rp<br />
Budget Line<br />
R* ----------<br />
RB ----------------<br />
Budget Line<br />
R:\<br />
0


