

Daniel l. Rubinfeld
Daniel l. Rubinfeld
Daniel l. Rubinfeld

You also want an ePaper? Increase the reach of your titles
YUMPU automatically turns print PDFs into web optimized ePapers that Google loves.
58 Part 1 Introduction: Markets and Prices<br />
a. Assuming, as before, that the equilibrium price<br />
and quantity are P* = 75 cents per pound and<br />
Q* 75 million metric tons per year, derive the<br />
linear demand curve consistent with the smaller<br />
elasticity.<br />
b. Using this demand curve, recalculate the effect of a<br />
20-percent decline in copper demand on the price<br />
of copper.<br />
8. Example 2.8 analyzes the world oil market. Using the<br />
data given in that example:<br />
a. Show that the short-run demand and competitive<br />
supply curves are indeed given by<br />
D = 24.,08 - 0.06P<br />
Sc = 11.74 + 0.07P<br />
b. Show that the long-run demand and competitive<br />
supply curves are indeed given by<br />
D = 32.18 - 051P<br />
Sc = 7.78 + 0.29P<br />
c. During the late 1990s, Saudi Arabia accounted for<br />
3 billion barrels per year of OPEC's production.<br />
Suppose that war or revolution caused Saudi<br />
Arabia to stop producing oil. Use the model above<br />
to calculate what would happen to the price of oil<br />
in the short run and the long run if OPEC's production<br />
were to drop by 3 billion barrels per year,<br />
9. Refer to Example 2.9, which analyzes the effects of<br />
price conh'ols on natural gas.<br />
a. Using the data in the example, show that the following<br />
supply and demand curves did indeed<br />
describe the market in 1975:<br />
Supply:<br />
Q = 14 + 2Pc + 0.25Po<br />
Demand: Q - 5P c + 3.75P 0,<br />
where Pc and Po are the prices of natural gas and<br />
oil, respectively Also verify that if the price of oil is<br />
$8.00, these curves imply a free-market price of<br />
$2.00 for natural gas.<br />
b. Suppose the regulated price of gas in 1975 had<br />
been $150 per thousand cubic feet instead of $1.00.<br />
How much excess demand would there have<br />
been<br />
c. Suppose that the market for natural gas had /lot<br />
been regulated. If the price of oil had increased<br />
from $8.00 to $16,00, what would have happened<br />
to the free market price of natural gas<br />
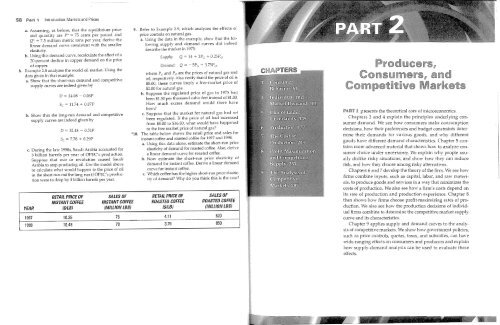
*10. The table below shows the retail price and sales for<br />
instant coffee and roasted coffee for 1997 and 1998,<br />
a. Using this data alone, estimate the short-run price<br />
elasticity of demand for roasted coffee, Also, derive<br />
a linear demand curve for roasted coffee,<br />
b. Now estimate the short-run price elasticity of<br />
demand for instant coffee. Derive a linear demand<br />
curve for instant coffee,<br />
c. Which coffee has the higher short-run price elasticity<br />
of demand Why do you think this is the case<br />
RETAIL PRICE OF<br />
SALES OF<br />
RETAIL PRICE OF<br />
SALES OF<br />
INSTANT COFFEE INSTANT COFFEE ROASTEO COFFEE ROASTED COFFEE<br />
YEAR ($/LB) (MILLION LBS) ($/LB) (MillION LBS)<br />
1997 10.35 75 4.11 820<br />
1998 10.48 70 3.76 850<br />
PART 2 presents the theoretical core of microeconomics.<br />
Chapters 3 and 4 explain the principles underlying consumer<br />
demand. We see how consumers make consumption<br />
decisions, how their preferences and budget constraints determine<br />
their demands for various goods, and why different<br />
goods have different demand characteristics. Chapter 5 contains<br />
more advanced material that shows how to analyze consumer<br />
choice under lmcertainty. We explain why people usually<br />
dislike risky situations, and show how they can reduce<br />
risk, and how they choose among risky alternatives.<br />
Chapters 6 and 7 develop the theory of the firm. We see how<br />
firms combine inputs, such as capital, labor, and raw materials,<br />
to produce goods and services in a way that minimizes the<br />
costs of production. We also see how a firm's costs depend on<br />
its rate of production and production experience. Chapter 8<br />
then shows how firms choose profit-maximizing rates of production.<br />
We also see how the production decisions of individual<br />
firms combine to determine the competitive market supply<br />
curve and its characteristics.<br />
Chapter 9 applies supply and demand curves to the analysis<br />
of competitive markets. We show how government policies,<br />
such as price controls, quotas, taxes, and subsidies, can have<br />
wide-ranging effects on consumers and producers and explain<br />
how supply-demand analysis can be used to evaluate these<br />
effects.


