east liberty station: realizing the potential - City of Pittsburgh
east liberty station: realizing the potential - City of Pittsburgh
east liberty station: realizing the potential - City of Pittsburgh

Create successful ePaper yourself
Turn your PDF publications into a flip-book with our unique Google optimized e-Paper software.
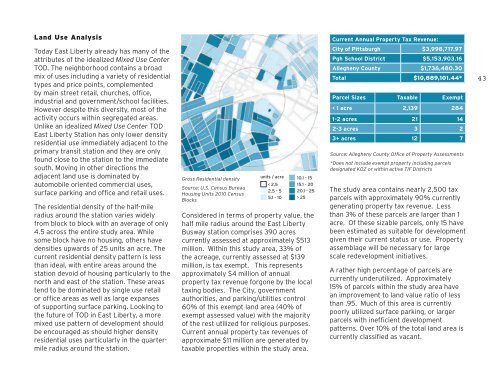
Land Use Analysis<br />
Current Annual Property Tax Revenue:<br />
Today East Liberty already has many <strong>of</strong> <strong>the</strong><br />
attributes <strong>of</strong> <strong>the</strong> idealized Mixed Use Center<br />
TOD. The neighborhood contains a broad<br />
mix <strong>of</strong> uses including a variety <strong>of</strong> residential<br />
types and price points, complemented<br />
by main street retail, churches, <strong>of</strong>fice,<br />
industrial and government/school facilities.<br />
However despite this diversity, most <strong>of</strong> <strong>the</strong><br />
activity occurs within segregated areas.<br />
Unlike an idealized Mixed Use Center TOD<br />
East Liberty Station has only lower density<br />
residential use immediately adjacent to <strong>the</strong><br />
primary transit <strong>station</strong> and <strong>the</strong>y are only<br />
found close to <strong>the</strong> <strong>station</strong> to <strong>the</strong> immediate<br />
south. Moving in o<strong>the</strong>r directions <strong>the</strong><br />
adjacent land use is dominated by<br />
automobile oriented commercial uses,<br />
surface parking and <strong>of</strong>fice and retail uses.<br />
The residential density <strong>of</strong> <strong>the</strong> half-mile<br />
radius around <strong>the</strong> <strong>station</strong> varies widely<br />
from block to block with an average <strong>of</strong> only<br />
4.5 across <strong>the</strong> entire study area. While<br />
some block have no housing, o<strong>the</strong>rs have<br />
densities upwards <strong>of</strong> 25 units an acre. The<br />
current residential density pattern is less<br />
than ideal, with entire areas around <strong>the</strong><br />
<strong>station</strong> devoid <strong>of</strong> housing particularly to <strong>the</strong><br />
north and <strong>east</strong> <strong>of</strong> <strong>the</strong> <strong>station</strong>. These areas<br />
tend to be dominated by single use retail<br />
or <strong>of</strong>fice areas as well as large expanses<br />
<strong>of</strong> supporting surface parking. Looking to<br />
<strong>the</strong> future <strong>of</strong> TOD in East Liberty, a more<br />
mixed use pattern <strong>of</strong> development should<br />
be encouraged as should higher density<br />
residential uses particularly in <strong>the</strong> quartermile<br />
radius around <strong>the</strong> <strong>station</strong>.<br />
Gross Residential density<br />
Source: U.S. Census Bureau<br />
Housing Units 2010 Census<br />
Blocks<br />
units / acre 10.1 - 15<br />
< 2.5<br />
2.5 - 5<br />
5.1 - 10<br />
15.1 - 20<br />
20.1 - 25<br />
> 25<br />
Considered in terms <strong>of</strong> property value, <strong>the</strong><br />
half mile radius around <strong>the</strong> East Liberty<br />
Busway <strong>station</strong> comprises 390 acres<br />
currently assessed at approximately $513<br />
million. Within this study area, 33% <strong>of</strong><br />
<strong>the</strong> acreage, currently assessed at $139<br />
million, is tax exempt. This represents<br />
approximately $4 million <strong>of</strong> annual<br />
property tax revenue forgone by <strong>the</strong> local<br />
taxing bodies. The <strong>City</strong>, government<br />
authorities, and parking/utilities control<br />
60% <strong>of</strong> this exempt land area (40% <strong>of</strong><br />
exempt assessed value) with <strong>the</strong> majority<br />
<strong>of</strong> <strong>the</strong> rest utilized for religious purposes.<br />
Current annual property tax revenues <strong>of</strong><br />
approximate $11 million are generated by<br />
taxable properties within <strong>the</strong> study area.<br />
<strong>City</strong> <strong>of</strong> <strong>Pittsburgh</strong> $3,998,717.97<br />
Pgh School District $5,153,903.16<br />
Allegheny County $1,736,480.30<br />
Total $10,889,101.44*<br />
Parcel Sizes Taxable Exempt<br />
< 1 acre 2,139 284<br />
1-2 acres 21 14<br />
2-3 acres 3 2<br />
3+ acres 12 7<br />
Source: Allegheny County Office <strong>of</strong> Property Assessments<br />
*Does not include exempt property including parcels<br />
designated KOZ or within active TIF Districts<br />
The study area contains nearly 2,500 tax<br />
parcels with approximately 90% currently<br />
generating property tax revenue. Less<br />
than 3% <strong>of</strong> <strong>the</strong>se parcels are larger than 1<br />
acre. Of <strong>the</strong>se sizable parcels, only 15 have<br />
been estimated as suitable for development<br />
given <strong>the</strong>ir current status or use. Property<br />
assemblage will be necessary for large<br />
scale redevelopment initiatives.<br />
A ra<strong>the</strong>r high percentage <strong>of</strong> parcels are<br />
currently underutilized. Approximately<br />
15% <strong>of</strong> parcels within <strong>the</strong> study area have<br />
an improvement to land value ratio <strong>of</strong> less<br />
than .95. Much <strong>of</strong> this area is currently<br />
poorly utilized surface parking, or larger<br />
parcels with inefficient development<br />
patterns. Over 10% <strong>of</strong> <strong>the</strong> total land area is<br />
currently classified as vacant.<br />
43