INFINITY ANALYZE User's Manual - Spectra Services
INFINITY ANALYZE User's Manual - Spectra Services
INFINITY ANALYZE User's Manual - Spectra Services
- No tags were found...

Create successful ePaper yourself
Turn your PDF publications into a flip-book with our unique Google optimized e-Paper software.
Lumenera <strong>INFINITY</strong> <strong>ANALYZE</strong><br />
User’s <strong>Manual</strong> Release 6.0.0<br />
If the Ctrl key is down when the right mouse button is clicked, the nucleus will be<br />
separated into two (or occasionally more) nucleuses.<br />
Double click the right mouse button in an area of the image that has not been<br />
highlighted, to complete the segmentation and complete the counting process.<br />
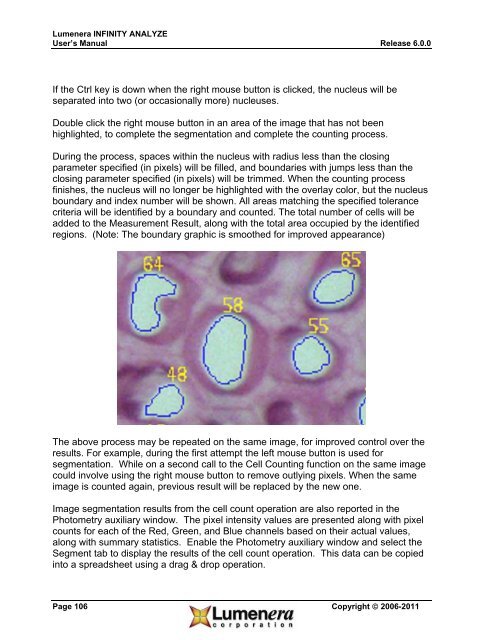
During the process, spaces within the nucleus with radius less than the closing<br />
parameter specified (in pixels) will be filled, and boundaries with jumps less than the<br />
closing parameter specified (in pixels) will be trimmed. When the counting process<br />
finishes, the nucleus will no longer be highlighted with the overlay color, but the nucleus<br />
boundary and index number will be shown. All areas matching the specified tolerance<br />
criteria will be identified by a boundary and counted. The total number of cells will be<br />
added to the Measurement Result, along with the total area occupied by the identified<br />
regions. (Note: The boundary graphic is smoothed for improved appearance)<br />
The above process may be repeated on the same image, for improved control over the<br />
results. For example, during the first attempt the left mouse button is used for<br />
segmentation. While on a second call to the Cell Counting function on the same image<br />
could involve using the right mouse button to remove outlying pixels. When the same<br />
image is counted again, previous result will be replaced by the new one.<br />
Image segmentation results from the cell count operation are also reported in the<br />
Photometry auxiliary window. The pixel intensity values are presented along with pixel<br />
counts for each of the Red, Green, and Blue channels based on their actual values,<br />
along with summary statistics. Enable the Photometry auxiliary window and select the<br />
Segment tab to display the results of the cell count operation. This data can be copied<br />
into a spreadsheet using a drag & drop operation.<br />
Page 106 Copyright © 2006-2011