Table B–2. Gross domestic product, 1999–2013—Continued [Quarterly data at seasonally adjusted annual rates] Year or quarter Net exports Net exports of goods and services Exports Imports Total Government consumption expenditures and gross investment Total Federal National defense Nondefense Billions of dollars State and local Final sales of domestic product Gross domestic purchases 1 Gross domestic income 2 Gross national product 3 1999 –261.4 989.2 1,250.6 1,726.0 610.4 382.7 227.7 1,115.6 9,604.9 9,927.1 9,698.1 9,692.8 2000 –380.1 1,094.3 1,474.4 1,834.4 632.4 391.7 240.7 1,202.0 10,235.2 10,669.8 10,384.3 10,326.8 2001 –369.0 1,028.8 1,397.8 1,958.8 669.2 412.7 256.5 1,289.5 10,663.5 10,994.3 10,736.8 10,677.1 2002 –425.0 1,004.7 1,429.7 2,094.9 740.6 456.8 283.8 1,354.3 10,961.7 11,405.2 11,050.3 11,028.8 2003 –500.9 1,043.4 1,544.3 2,220.8 824.8 519.9 304.9 1,396.0 11,493.0 12,013.2 11,524.3 11,580.3 2004 –614.8 1,183.1 1,797.9 2,357.4 892.4 570.2 322.1 1,465.0 12,213.2 12,891.8 12,283.5 12,367.1 2005 –715.7 1,310.4 2,026.1 2,493.7 946.3 608.3 338.1 1,547.4 13,035.8 13,811.1 13,129.2 13,189.0 2006 –762.4 1,478.5 2,240.9 2,642.2 1,002.0 642.4 359.6 1,640.2 13,790.9 14,620.3 14,073.2 13,926.3 2007 –709.8 1,665.7 2,375.5 2,801.9 1,049.8 678.7 371.0 1,752.2 14,445.9 15,190.1 14,460.1 14,606.8 2008 –713.2 1,843.1 2,556.4 3,003.2 1,155.6 754.1 401.5 1,847.6 14,752.3 15,433.5 14,621.2 14,893.2 2009 –392.2 1,583.8 1,976.0 3,089.1 1,217.7 788.3 429.4 1,871.4 14,565.5 14,810.1 14,345.7 14,565.1 2010 –518.5 1,843.5 2,362.0 3,174.0 1,303.9 832.8 471.1 1,870.2 14,896.7 15,476.7 14,915.2 15,164.2 2011 –568.7 2,101.2 2,669.9 3,158.7 1,304.1 835.8 468.2 1,854.7 15,497.4 16,102.6 15,587.5 15,794.6 2012 –547.2 2,195.9 2,743.1 3,167.0 1,295.7 817.1 478.6 1,871.3 16,178.5 16,791.8 16,261.6 16,497.4 2013 p –497.3 2,259.8 2,757.0 3,124.9 1,245.9 770.8 475.1 1,879.0 16,689.6 17,294.8 2010: I –495.1 1,746.4 2,241.4 3,135.7 1,269.2 811.9 457.3 1,866.5 14,660.4 15,167.5 14,627.4 14,875.9 II –529.7 1,807.0 2,336.7 3,181.5 1,304.6 829.3 475.2 1,876.9 14,829.0 15,408.9 14,793.7 15,084.3 III –543.8 1,860.3 2,404.0 3,194.7 1,321.6 846.3 475.3 1,873.1 14,928.2 15,593.5 15,050.5 15,249.5 IV –505.3 1,960.4 2,465.7 3,184.2 1,320.1 843.5 476.6 1,864.2 15,169.3 15,737.0 15,189.0 15,447.2 2011: I –554.7 2,029.5 2,584.1 3,150.0 1,297.4 822.0 475.4 1,852.6 15,221.4 15,797.6 15,326.2 15,491.2 II –572.2 2,095.5 2,667.7 3,171.7 1,315.4 844.2 471.2 1,856.3 15,416.2 16,034.1 15,513.6 15,712.1 III –553.7 2,143.4 2,697.1 3,164.6 1,308.5 851.6 456.9 1,856.1 15,625.3 16,165.5 15,694.9 15,884.0 IV –594.4 2,136.2 2,730.7 3,148.5 1,294.9 825.6 469.3 1,853.6 15,726.8 16,413.1 15,815.3 16,091.0 2012: I –590.8 2,173.4 2,764.2 3,159.7 1,291.8 816.3 475.5 1,867.9 15,938.7 16,632.4 16,104.6 16,289.6 II –557.9 2,197.4 2,755.3 3,164.1 1,293.8 816.7 477.1 1,870.3 16,093.6 16,718.3 16,150.3 16,419.2 III –524.4 2,199.2 2,723.5 3,193.5 1,322.1 841.9 480.2 1,871.4 16,274.4 16,880.4 16,269.6 16,603.7 IV –515.8 2,213.7 2,729.5 3,150.7 1,275.2 793.7 481.5 1,875.4 16,407.3 16,936.1 16,522.0 16,677.3 2013: I –523.1 2,214.2 2,737.3 3,124.1 1,255.0 775.8 479.2 1,869.1 16,471.9 17,058.4 16,690.9 16,772.7 II –509.0 2,238.9 2,747.9 3,121.9 1,252.6 776.3 476.3 1,869.3 16,583.8 17,170.0 16,847.8 16,907.9 III –500.2 2,265.8 2,766.0 3,137.5 1,251.2 777.3 473.9 1,886.3 16,768.1 17,413.2 17,004.6 17,175.9 IV p –456.8 2,320.1 2,776.9 3,116.2 1,224.8 753.7 471.1 1,891.4 16,934.4 17,537.5 Billions of chained (2009) dollars 1999 –382.3 1,174.1 1,556.4 2,451.7 815.3 516.9 298.5 1,643.6 12,000.3 12,474.6 12,111.9 12,108.9 2000 –482.7 1,272.4 1,755.1 2,498.2 817.7 512.3 305.4 1,689.1 12,500.4 13,069.5 12,680.6 12,614.3 2001 –504.2 1,200.5 1,704.7 2,592.4 849.8 530.0 319.7 1,751.5 12,731.7 13,213.5 12,817.6 12,750.2 2002 –584.9 1,178.1 1,763.0 2,705.8 910.8 567.3 343.3 1,802.4 12,889.9 13,520.1 12,992.1 12,970.8 2003 –641.6 1,197.2 1,838.8 2,764.3 973.0 615.4 357.5 1,795.3 13,247.9 13,937.1 13,283.9 13,352.2 2004 –731.9 1,309.3 2,041.2 2,808.2 1,017.1 652.7 364.5 1,792.8 13,702.7 14,529.1 13,781.3 13,879.0 2005 –777.1 1,388.4 2,165.5 2,826.2 1,034.8 665.5 369.4 1,792.3 14,170.1 15,036.2 14,272.3 14,340.8 2006 –786.2 1,512.4 2,298.6 2,869.3 1,060.9 678.8 382.1 1,808.8 14,543.6 15,424.8 14,842.3 14,690.9 2007 –703.6 1,647.3 2,350.9 2,914.4 1,078.7 695.6 383.1 1,836.1 14,839.2 15,600.8 14,856.1 15,009.7 2008 –546.9 1,741.8 2,288.7 2,994.8 1,152.3 748.1 404.2 1,842.4 14,868.9 15,392.0 14,733.8 15,009.0 2009 –392.2 1,583.8 1,976.0 3,089.1 1,217.7 788.3 429.4 1,871.4 14,565.5 14,810.1 14,345.7 14,565.1 2010 –462.6 1,765.6 2,228.1 3,091.4 1,270.7 813.5 457.1 1,820.8 14,717.7 15,244.5 14,736.7 14,966.5 2011 –445.9 1,890.5 2,336.4 2,992.3 1,237.9 794.6 443.3 1,754.5 15,014.4 15,501.1 15,104.3 15,286.7 2012 –430.8 1,957.4 2,388.2 2,963.1 1,220.3 769.1 451.2 1,742.8 15,403.2 15,902.3 15,487.0 15,693.1 2013 p –412.3 2,010.0 2,422.3 2,896.3 1,157.4 715.0 442.4 1,738.6 15,665.8 16,170.4 2010: I –413.6 1,700.4 2,113.9 3,084.3 1,247.8 798.6 449.2 1,836.5 14,584.3 15,011.5 14,552.8 14,782.7 II –474.3 1,739.3 2,213.6 3,106.2 1,273.4 811.0 462.4 1,832.8 14,686.3 15,215.4 14,653.4 14,925.1 III –504.9 1,784.9 2,289.8 3,103.5 1,285.0 825.9 459.1 1,818.5 14,718.3 15,348.5 14,840.1 15,020.5 IV –457.5 1,837.7 2,295.2 3,071.5 1,276.4 818.6 457.7 1,795.2 14,881.8 15,402.5 14,900.5 15,137.8 2011: I –456.5 1,854.7 2,311.3 3,012.0 1,241.6 787.8 453.7 1,770.5 14,871.9 15,354.0 14,975.4 15,119.2 II –438.3 1,876.9 2,315.2 3,002.4 1,247.0 800.8 446.2 1,755.5 14,961.8 15,451.6 15,061.5 15,235.6 III –433.9 1,908.9 2,342.8 2,983.2 1,236.4 805.6 430.8 1,746.9 15,072.7 15,498.4 15,142.2 15,306.4 IV –454.7 1,921.7 2,376.4 2,971.7 1,226.7 784.2 442.5 1,745.0 15,151.3 15,700.5 15,238.8 15,485.7 2012: I –439.2 1,941.4 2,380.6 2,961.3 1,219.1 770.7 448.3 1,742.2 15,278.9 15,822.4 15,441.9 15,600.2 II –435.3 1,959.8 2,395.1 2,963.5 1,218.5 768.8 449.7 1,745.0 15,360.8 15,864.4 15,418.0 15,656.2 III –436.5 1,961.6 2,398.0 2,988.8 1,244.6 791.8 452.8 1,744.3 15,444.9 15,971.4 15,451.9 15,751.1 IV –412.1 1,967.0 2,379.1 2,938.8 1,198.9 745.0 453.9 1,739.8 15,528.3 15,950.8 15,636.0 15,764.8 2013: I –422.3 1,960.5 2,382.7 2,907.4 1,172.8 723.1 449.8 1,734.3 15,536.4 16,005.8 15,730.6 15,789.7 II –424.4 1,998.4 2,422.9 2,904.5 1,168.2 722.0 446.2 1,736.0 15,616.2 16,104.1 15,855.4 15,893.9 III –419.8 2,017.6 2,437.3 2,907.4 1,163.9 721.2 442.7 1,743.2 15,711.1 16,258.5 15,925.2 16,067.4 IV p –382.8 2,063.5 2,446.2 2,866.2 1,124.7 693.6 431.1 1,741.1 15,799.4 16,313.1 1 Gross domestic product (GDP) less exports of goods and services plus imports of goods and services. 2 For chained dollar measures, gross domestic income is deflated by the implicit price deflator for GDP. 3 GDP plus net income receipts from rest of the world. Source: Department of Commerce (Bureau of Economic Analysis). GDP, Income, Prices, and Selected Indicators | 369
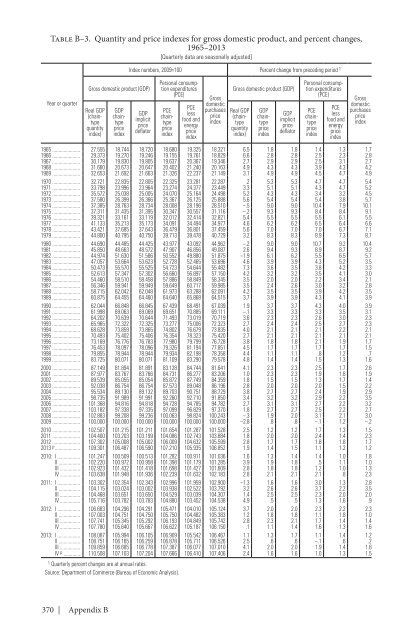
Table B–3. Quantity and price indexes for gross domestic product, and percent changes, 1965–2013 [Quarterly data are seasonally adjusted] Year or quarter Gross domestic product (GDP) Real GDP (chaintype quantity index) GDP chaintype price index Index numbers, 2009=100 Percent change from preceding period 1 GDP implicit price deflator Personal consumption expenditures (PCE) PCE chaintype price index PCE less food and energy price index Gross domestic purchases price index Gross domestic product (GDP) Real GDP (chaintype quantity index) GDP chaintype price index GDP implicit price deflator Personal consumption expenditures (PCE) PCE chaintype price index PCE less food and energy price index Gross domestic purchases price index 1965 27.555 18.744 18.720 18.680 19.325 18.321 6.5 1.8 1.8 1.4 1.3 1.7 1966 29.373 19.270 19.246 19.155 19.761 18.829 6.6 2.8 2.8 2.5 2.3 2.8 1967 30.179 19.830 19.805 19.637 20.367 19.346 2.7 2.9 2.9 2.5 3.1 2.7 1968 31.660 20.673 20.647 20.402 21.240 20.163 4.9 4.3 4.3 3.9 4.3 4.2 1969 32.653 21.692 21.663 21.326 22.237 21.149 3.1 4.9 4.9 4.5 4.7 4.9 1970 32.721 22.835 22.805 22.325 23.281 22.287 .2 5.3 5.3 4.7 4.7 5.4 1971 33.798 23.996 23.964 23.274 24.377 23.449 3.3 5.1 5.1 4.3 4.7 5.2 1972 35.572 25.038 25.005 24.070 25.164 24.498 5.2 4.3 4.3 3.4 3.2 4.5 1973 37.580 26.399 26.366 25.367 26.125 25.888 5.6 5.4 5.4 5.4 3.8 5.7 1974 37.385 28.763 28.734 28.008 28.196 28.510 –.5 9.0 9.0 10.4 7.9 10.1 1975 37.311 31.435 31.395 30.347 30.557 31.116 –.2 9.3 9.3 8.4 8.4 9.1 1976 39.321 33.161 33.119 32.012 32.414 32.821 5.4 5.5 5.5 5.5 6.1 5.5 1977 41.133 35.213 35.173 34.091 34.494 34.977 4.6 6.2 6.2 6.5 6.4 6.6 1978 43.421 37.685 37.643 36.479 36.801 37.459 5.6 7.0 7.0 7.0 6.7 7.1 1979 44.800 40.795 40.750 39.713 39.478 40.729 3.2 8.3 8.3 8.9 7.3 8.7 1980 44.690 44.485 44.425 43.977 43.092 44.962 –.2 9.0 9.0 10.7 9.2 10.4 1981 45.850 48.663 48.572 47.907 46.856 49.087 2.6 9.4 9.3 8.9 8.7 9.2 1982 44.974 51.630 51.586 50.552 49.880 51.875 –1.9 6.1 6.2 5.5 6.5 5.7 1983 47.057 53.664 53.623 52.728 52.465 53.696 4.6 3.9 3.9 4.3 5.2 3.5 1984 50.473 55.570 55.525 54.723 54.644 55.482 7.3 3.6 3.5 3.8 4.2 3.3 1985 52.613 57.347 57.302 56.660 56.897 57.150 4.2 3.2 3.2 3.5 4.1 3.0 1986 54.460 58.510 58.458 57.886 58.849 58.345 3.5 2.0 2.0 2.2 3.4 2.1 1987 56.346 59.941 59.949 59.649 60.717 59.985 3.5 2.4 2.6 3.0 3.2 2.8 1988 58.715 62.042 62.048 61.973 63.288 62.091 4.2 3.5 3.5 3.9 4.2 3.5 1989 60.875 64.455 64.460 64.640 65.868 64.515 3.7 3.9 3.9 4.3 4.1 3.9 1990 62.044 66.848 66.845 67.439 68.491 67.039 1.9 3.7 3.7 4.3 4.0 3.9 1991 61.998 69.063 69.069 69.651 70.885 69.111 –.1 3.3 3.3 3.3 3.5 3.1 1992 64.202 70.639 70.644 71.493 73.019 70.719 3.6 2.3 2.3 2.6 3.0 2.3 1993 65.965 72.322 72.325 73.277 75.006 72.323 2.7 2.4 2.4 2.5 2.7 2.3 1994 68.628 73.859 73.865 74.802 76.679 73.835 4.0 2.1 2.1 2.1 2.2 2.1 1995 70.493 75.402 75.406 76.354 78.323 75.420 2.7 2.1 2.1 2.1 2.1 2.1 1996 73.169 76.776 76.783 77.980 79.799 76.728 3.8 1.8 1.8 2.1 1.9 1.7 1997 76.453 78.097 78.096 79.326 81.194 77.851 4.5 1.7 1.7 1.7 1.7 1.5 1998 79.855 78.944 78.944 79.934 82.198 78.358 4.4 1.1 1.1 .8 1.2 .7 1999 83.725 80.071 80.071 81.109 83.290 79.578 4.8 1.4 1.4 1.5 1.3 1.6 2000 87.149 81.894 81.891 83.128 84.744 81.641 4.1 2.3 2.3 2.5 1.7 2.6 2001 87.977 83.767 83.766 84.731 86.277 83.206 1.0 2.3 2.3 1.9 1.8 1.9 2002 89.539 85.055 85.054 85.872 87.749 84.359 1.8 1.5 1.5 1.3 1.7 1.4 2003 92.038 86.754 86.754 87.573 89.048 86.196 2.8 2.0 2.0 2.0 1.5 2.2 2004 95.534 89.130 89.132 89.703 90.751 88.729 3.8 2.7 2.7 2.4 1.9 2.9 2005 98.735 91.989 91.991 92.260 92.710 91.850 3.4 3.2 3.2 2.9 2.2 3.5 2006 101.368 94.816 94.818 94.728 94.785 94.782 2.7 3.1 3.1 2.7 2.2 3.2 2007 103.182 97.338 97.335 97.099 96.829 97.370 1.8 2.7 2.7 2.5 2.2 2.7 2008 102.883 99.208 99.236 100.063 98.824 100.243 –.3 1.9 2.0 3.1 2.1 3.0 2009 100.000 100.000 100.000 100.000 100.000 100.000 –2.8 .8 .8 –.1 1.2 –.2 2010 102.507 101.215 101.211 101.654 101.287 101.528 2.5 1.2 1.2 1.7 1.3 1.5 2011 104.400 103.203 103.199 104.086 102.743 103.884 1.8 2.0 2.0 2.4 1.4 2.3 2012 107.302 105.008 105.002 106.009 104.632 105.599 2.8 1.7 1.7 1.8 1.8 1.7 2013 p 109.301 106.487 106.590 107.210 105.935 106.852 1.9 1.4 1.5 1.1 1.2 1.2 2010: I 101.247 100.509 100.513 101.282 100.911 101.036 1.6 1.3 1.4 1.4 1.0 1.8 II 102.220 100.972 100.958 101.398 101.179 101.285 3.9 1.9 1.8 .5 1.1 1.0 III 102.923 101.432 101.418 101.698 101.427 101.609 2.8 1.8 1.8 1.2 1.0 1.3 IV 103.638 101.948 101.936 102.239 101.632 102.183 2.8 2.1 2.1 2.1 .8 2.3 2011: I 103.302 102.354 102.343 102.996 101.959 102.900 –1.3 1.6 1.6 3.0 1.3 2.8 II 104.115 103.024 103.002 103.938 102.522 103.792 3.2 2.6 2.6 3.7 2.2 3.5 III 104.468 103.651 103.650 104.529 103.039 104.307 1.4 2.5 2.5 2.3 2.0 2.0 IV 105.716 103.782 103.783 104.880 103.452 104.538 4.9 .5 .5 1.3 1.6 .9 2012: I 106.683 104.296 104.291 105.471 104.010 105.124 3.7 2.0 2.0 2.3 2.2 2.3 II 107.003 104.751 104.750 105.750 104.482 105.383 1.2 1.8 1.8 1.1 1.8 1.0 III 107.741 105.345 105.292 106.193 104.849 105.742 2.8 2.3 2.1 1.7 1.4 1.4 IV 107.780 105.640 105.667 106.622 105.187 106.150 .1 1.1 1.4 1.6 1.3 1.6 2013: I 108.087 105.994 106.105 106.909 105.542 106.467 1.1 1.3 1.7 1.1 1.4 1.2 II 108.751 106.165 106.259 106.878 105.711 106.526 2.5 .6 .6 –.1 .6 .2 III 109.859 106.685 106.778 107.387 106.077 107.010 4.1 2.0 2.0 1.9 1.4 1.8 IV p 110.508 107.103 107.204 107.666 106.410 107.406 2.4 1.6 1.6 1.0 1.3 1.5 1 Quarterly percent changes are at annual rates. Source: Department of Commerce (Bureau of Economic Analysis). 370 | Appendix B
- Page 1 and 2:
ECONOMIC REPORT OF THE PRESIDENT To
- Page 4:
C O N T E N T S ECONOMIC REPORT OF
- Page 8 and 9:
economic report of the president To
- Page 10 and 11:
year-old. In the meantime, I’m go
- Page 12:
the annual report of the council of
- Page 16 and 17:
C O N T E N T S CHAPTER 1. PROMOTIN
- Page 18 and 19:
APPENDIX 1: COMPONENTS OF THE RECOV
- Page 20 and 21:
THE OBAMA ADMINISTRATION’S RECORD
- Page 22 and 23:
2.15. Housing Starts, 1960-2013....
- Page 24 and 25:
3.1. Forecasted and Actual Real GDP
- Page 26 and 27:
C H A P T E R 1 PROMOTING OPPORTUNI
- Page 28 and 29:
Opportunity, Growth, and Security i
- Page 30 and 31:
crisis—continue to rebound and co
- Page 32 and 33:
Figure 1-4 Real GDP Per Working-Age
- Page 34 and 35:
Figure 1-6 Change in Poverty Rate F
- Page 36 and 37:
Figure 1-7 Domestic Crude Oil Produ
- Page 38 and 39:
Figure 1-8 Growth in Real Per Capit
- Page 40 and 41:
Figure 1-9 Unemployment Rate by Dur
- Page 42 and 43:
e needed to make up for a decades-l
- Page 44 and 45:
Annual percent change 2.50 15-year
- Page 46 and 47:
Figure 1-14 Share of National Incom
- Page 48:
Along with steps that create jobs,
- Page 51 and 52:
corner, with purchases increasing d
- Page 53 and 54:
the four quarters of 2013, or enoug
- Page 55 and 56:
Percent of GDP 12 10 8 6 4 2 0 -2 -
- Page 57 and 58:
Percent 5.0 4.0 3.0 2.0 Figure 2-3
- Page 59 and 60:
In the euro area, the unemployment
- Page 61 and 62:
Figure 2-6 Cumulative Flows into Mu
- Page 63 and 64:
Figure 2-7 Household Deleveraging,
- Page 65 and 66:
Box 2-1: The 2013 Comprehensive Rev
- Page 67 and 68:
Percent 25 20 15 10 5 0 -5 Figure 2
- Page 69 and 70:
Figure 2-11 State and Local Pension
- Page 71 and 72:
Percent of GDP 2 1 0 Figure 2-14 Cu
- Page 73 and 74:
Box 2-2. Administration Trade Polic
- Page 75 and 76:
Upon completion, the TPP and T-TIP
- Page 77 and 78:
percent of households report that i
- Page 79 and 80:
Figure 2-18 Petroleum Net Imports,
- Page 81 and 82:
Figure 2-21 U.S. Per Capita Consump
- Page 83 and 84:
Percent 11 Figure 2-22 Unemployment
- Page 85 and 86:
Figure 2-25 Predicted vs. Actual Ma
- Page 87 and 88:
Box 2-4: Unemployment Duration and
- Page 89 and 90:
The Long-Term Outlook The 11-Year F
- Page 91 and 92:
Growth in GDP over the Long Term As
- Page 93 and 94:
Box 2-5: Immigration Reform and Pot
- Page 95 and 96:
Even with this growth, however, the
- Page 97 and 98:
families. The other half was for in
- Page 99 and 100:
ecause of rapidly declining stock a
- Page 101 and 102:
Obama Administration and the 111th
- Page 103 and 104:
Figure 3-1 Recovery Act Programs by
- Page 105 and 106:
other cases, new measures expanded
- Page 107 and 108:
Figure 3-2 Recovery Act and Subsequ
- Page 109 and 110:
Box 3-1: Other Administration Polic
- Page 111 and 112:
challenges, and how economists have
- Page 113 and 114:
Table 3-5 Estimated Output Multipli
- Page 115 and 116:
Figure 3-7 Quarterly Effect of the
- Page 117 and 118:
Table 3-6 Estimates of the Effects
- Page 119 and 120:
International Comparison The 2008 c
- Page 121 and 122:
Box 3-2: The U.S. Recovery in Compa
- Page 123 and 124:
Table 3-7 Tax Relief and Income Sup
- Page 125 and 126:
traditionally been jointly financed
- Page 127 and 128:
downturn in the economy. Even thoug
- Page 129 and 130:
Figure 3-11 Recovery Act Cumulative
- Page 131 and 132:
The Recovery Act also invested in r
- Page 133 and 134:
helped individuals who chose to ret
- Page 135 and 136:
the period, even though total power
- Page 137 and 138:
average—then the resulting increa
- Page 139 and 140:
Alternative Minimum Tax relief, bus
- Page 141 and 142:
Through the end of a Individual Tax
- Page 143 and 144:
y Poterba (1994), states and locali
- Page 145 and 146:
Table 3-11 Fiscal Support for the E
- Page 147 and 148:
spells. Because the resulting unemp
- Page 149 and 150:
literature uses two different appro
- Page 151 and 152:
Table 3-12 Summary of Cross-Section
- Page 153 and 154:
the CMS projections show real per-c
- Page 155 and 156:
will accrue to workers as higher wa
- Page 157 and 158:
Box 4-1: Two Measures of Growth in
- Page 159 and 160:
Figure 4-1 Growth in Real Per Capit
- Page 161 and 162:
in particular may not exactly track
- Page 163 and 164:
find that even those seniors who di
- Page 165 and 166:
the slowdown in real (that is, infl
- Page 167 and 168:
health care costs for an individual
- Page 169 and 170:
estimate for the ACA found that its
- Page 171 and 172:
Figure 4-4 Medicare 30-Day, All-Con
- Page 173 and 174:
agreements among the providers them
- Page 175 and 176:
payment for physician services, the
- Page 177 and 178:
Box 4-3: The Cost Slowdown and ACA
- Page 179 and 180:
2010a; 2011; 2012c; 2013a; 2014), w
- Page 181 and 182:
Figure 4-6 Recent CBO Projections o
- Page 183 and 184:
Conclusion The evidence is clear th
- Page 185 and 186:
facilitated this private-sector tec
- Page 187 and 188:
esulting gap between the actual gro
- Page 189 and 190:
Table 5-1 Sources of Productivity I
- Page 191 and 192:
Table 5-2 Nonfarm Private Business
- Page 193 and 194:
of the productivity improvement res
- Page 195 and 196:
Figure 5-3 Growth in Productivity a
- Page 197 and 198:
improving and college completion ra
- Page 199 and 200:
Box 5-2: Does Inequality Affect Pro
- Page 201 and 202:
Percent 3.5 Figure 5-5 Composition
- Page 203 and 204:
• Just two of the largest U.S. te
- Page 205 and 206:
Box 5-3: Just-in-Time Manufacturing
- Page 207 and 208:
Figure 5-7 Exclusive and Shared All
- Page 209 and 210:
Box 5-4: Spectrum Investment Polici
- Page 211 and 212:
To stimulate investment in more adv
- Page 213 and 214:
Because current uses of technology
- Page 215 and 216:
Box 5-5: Electronic Health Records
- Page 217 and 218:
about the array of services and sup
- Page 219 and 220:
and, in such cases, provides partie
- Page 221 and 222:
Box 5-6: The Leahy-Smith America In
- Page 223 and 224:
Box 5-7: Pay-For-Delay Settlements
- Page 226 and 227:
C H A P T E R 6 THE WAR ON POVERTY
- Page 228 and 229:
Measuring Poverty: Who is Poor in A
- Page 230 and 231:
thresholds ever since. These dollar
- Page 232 and 233:
of necessary items, including food,
- Page 234 and 235:
Table 6-1 Poverty Rates by Selected
- Page 236 and 237:
Box 6-3: Women and Poverty While wo
- Page 238 and 239:
However, this reflects smaller decl
- Page 240 and 241:
Percent 25 Figure 6-1 Trends in the
- Page 242 and 243:
Box 6-4: Social Programs Serve All
- Page 244 and 245:
of low- and middle-income workers a
- Page 246 and 247:
particularly valuable since they es
- Page 248 and 249:
Figure 6-4 Official vs Anchored Sup
- Page 250 and 251:
deep market poverty driven by the b
- Page 252 and 253:
work: in 2010, for example, unemplo
- Page 254 and 255:
out of poverty through job training
- Page 256 and 257:
e noted that researchers have found
- Page 258 and 259:
2012). Among the children of low-ea
- Page 260 and 261:
Education appears to be one of the
- Page 262 and 263:
Friedman, and Rockoff (2011) find t
- Page 264 and 265:
including an additional $25 a week
- Page 266 and 267:
Figure 6-11 Recovery Act and Subseq
- Page 268 and 269:
Empowering Every Child with a Quali
- Page 270 and 271:
modernize America’s high schools
- Page 272 and 273:
low-income Americans and their chil
- Page 274 and 275:
C H A P T E R 7 EVALUATION AS A TOO
- Page 276 and 277:
program evaluation efforts. For exa
- Page 278 and 279:
went to preschool would have had if
- Page 280 and 281:
y adopting successful interventions
- Page 282 and 283:
Box 7-2: Using Behavioral Economics
- Page 284 and 285:
Box 7-3: “Rapid Cycle” Evaluati
- Page 286 and 287:
Figure 7-1 Outlays for Grants to St
- Page 288 and 289:
performance data, fewer than half o
- Page 290 and 291:
Investment Act programs. The PROMIS
- Page 292 and 293:
Figure 7-2 Inventory of Beds for Ho
- Page 294 and 295:
example, included a nondiscretionar
- Page 296 and 297:
Other benefits of considering evalu
- Page 298 and 299:
with the treatment effect and thus
- Page 300 and 301:
unemployment insurance wage and ben
- Page 302 and 303:
hard for researchers to access for
- Page 304 and 305:
REFERENCES Chapter 1 Almunia, Migue
- Page 306 and 307:
____. 2014. “Press Release: Janua
- Page 308 and 309:
and the TPP at the Peterson Institu
- Page 310 and 311:
Increase Employment Evidence from t
- Page 312 and 313:
___. 2010b. “The Economic Impact
- Page 314 and 315:
___. 2012. World Economic Outlook A
- Page 316 and 317:
Polak Annual Research Conference. W
- Page 318 and 319:
Baicker, Katherine and Amitabh Chan
- Page 320 and 321:
Daly, Mary, Bart Hobijn, and Brian
- Page 322 and 323:
Nominal Wages,” International Jou
- Page 324 and 325: Learning: A Meta-Analysis and Revie
- Page 326 and 327: Chien, Colleen V. 2012. “Reformin
- Page 328 and 329: GAO (Government Accountability Offi
- Page 330 and 331: Jorgenson, Dale. 2001. “Informati
- Page 332 and 333: Integration in Economic Development
- Page 334 and 335: _____. 2007. “Improving the Safet
- Page 336 and 337: Dahl, Gordon B. and Lance Lochner.
- Page 338 and 339: Heckman, James J. and Dimitriy V. M
- Page 340 and 341: Ludwig, Jens and Douglas Miller. 20
- Page 342 and 343: Sharkey, Patrick. 2009. “Neighbor
- Page 344 and 345: _____. 2013. “Practical Evaluatio
- Page 346 and 347: www.nij.gov/topics/corrections/comm
- Page 348: Stock, James H., and Mark Watson. 2
- Page 352 and 353: letter of transmittal Council of Ec
- Page 354: Council Members and Their Dates of
- Page 357 and 358: The Members of the Council Betsey S
- Page 359 and 360: Act has had on reducing health care
- Page 361 and 362: Statistical Office The Statistical
- Page 364: A P P E N D I X B STATISTICAL TABLE
- Page 367 and 368: INTEREST RATES, MONEY STOCK, AND GO
- Page 369 and 370: 2013-to-2014 TABLE NUMBER MATCH 201
- Page 371 and 372: Year or quarter Table B-1. Percent
- Page 373: Table B-2. Gross domestic product,
- Page 377 and 378: Table B-5. Real exports and imports
- Page 379 and 380: Year Total 2 Table B-7. Real farm i
- Page 381 and 382: Table B-9. Median money income (in
- Page 383 and 384: Year or month Civilian noninstituti
- Page 385 and 386: Year or month All civilian workers
- Page 387 and 388: Table B-14. Employees on nonagricul
- Page 389 and 390: Table B-15. Hours and earnings in p
- Page 391 and 392: Year and month Interest Rates, Mone
- Page 393 and 394: Year and month Table B-18. Money st
- Page 395 and 396: Table B-20. Federal receipts, outla
- Page 397 and 398: Table B-22. Federal receipts, outla
- Page 399 and 400: Table B-24. State and local governm
- Page 401 and 402: End of month Table B-26. Estimated
- Page 403 and 404: B-7. Chain-type price indexes for g
- Page 405 and 406: B-28. National income by type of in
- Page 407 and 408: B-48. Employment cost index, privat
- Page 409 and 410: B-65. Producer price indexes by sta
- Page 411 and 412: B-81. Federal receipts, outlays, su
- Page 413 and 414: B-99. Farm output and productivity
- Page 415: B-111. International reserves Inter