Table B–8. New private housing units started, authorized, and completed and houses sold, 1970–2014 [Thousands; monthly data at seasonally adjusted annual rates] Year or month Total Type of structure Type of structure New housing units completed 1 unit 2 to 4 units 2 5 units or more Total 1 unit 2 to 4 units 5 units or more New houses sold 1970 1,433.6 812.9 84.9 535.9 1,351.5 646.8 88.1 616.7 1,418.4 485 1971 2,052.2 1,151.0 120.5 780.9 1,924.6 906.1 132.9 885.7 1,706.1 656 1972 2,356.6 1,309.2 141.2 906.2 2,218.9 1,033.1 148.6 1,037.2 2,003.9 718 1973 2,045.3 1,132.0 118.2 795.0 1,819.5 882.1 117.0 820.5 2,100.5 634 1974 1,337.7 888.1 68.0 381.6 1,074.4 643.8 64.4 366.2 1,728.5 519 1975 1,160.4 892.2 64.0 204.3 939.2 675.5 63.8 199.8 1,317.2 549 1976 1,537.5 1,162.4 85.8 289.2 1,296.2 893.6 93.1 309.5 1,377.2 646 1977 1,987.1 1,450.9 121.7 414.4 1,690.0 1,126.1 121.3 442.7 1,657.1 819 1978 2,020.3 1,433.3 125.1 462.0 1,800.5 1,182.6 130.6 487.3 1,867.5 817 1979 1,745.1 1,194.1 122.0 429.0 1,551.8 981.5 125.4 444.8 1,870.8 709 1980 1,292.2 852.2 109.5 330.5 1,190.6 710.4 114.5 365.7 1,501.6 545 1981 1,084.2 705.4 91.2 287.7 985.5 564.3 101.8 319.4 1,265.7 436 1982 1,062.2 662.6 80.1 319.6 1,000.5 546.4 88.3 365.8 1,005.5 412 1983 1,703.0 1,067.6 113.5 522.0 1,605.2 901.5 133.7 570.1 1,390.3 623 1984 1,749.5 1,084.2 121.4 543.9 1,681.8 922.4 142.6 616.8 1,652.2 639 1985 1,741.8 1,072.4 93.5 576.0 1,733.3 956.6 120.1 656.6 1,703.3 688 1986 1,805.4 1,179.4 84.0 542.0 1,769.4 1,077.6 108.4 583.5 1,756.4 750 1987 1,620.5 1,146.4 65.1 408.7 1,534.8 1,024.4 89.3 421.1 1,668.8 671 1988 1,488.1 1,081.3 58.7 348.0 1,455.6 993.8 75.7 386.1 1,529.8 676 1989 1,376.1 1,003.3 55.3 317.6 1,338.4 931.7 66.9 339.8 1,422.8 650 1990 1,192.7 894.8 37.6 260.4 1,110.8 793.9 54.3 262.6 1,308.0 534 1991 1,013.9 840.4 35.6 137.9 948.8 753.5 43.1 152.1 1,090.8 509 1992 1,199.7 1,029.9 30.9 139.0 1,094.9 910.7 45.8 138.4 1,157.5 610 1993 1,287.6 1,125.7 29.4 132.6 1,199.1 986.5 52.4 160.2 1,192.7 666 1994 1,457.0 1,198.4 35.2 223.5 1,371.6 1,068.5 62.2 241.0 1,346.9 670 1995 1,354.1 1,076.2 33.8 244.1 1,332.5 997.3 63.8 271.5 1,312.6 667 1996 1,476.8 1,160.9 45.3 270.8 1,425.6 1,069.5 65.8 290.3 1,412.9 757 1997 1,474.0 1,133.7 44.5 295.8 1,441.1 1,062.4 68.4 310.3 1,400.5 804 1998 1,616.9 1,271.4 42.6 302.9 1,612.3 1,187.6 69.2 355.5 1,474.2 886 1999 1,640.9 1,302.4 31.9 306.6 1,663.5 1,246.7 65.8 351.1 1,604.9 880 2000 1,568.7 1,230.9 38.7 299.1 1,592.3 1,198.1 64.9 329.3 1,573.7 877 2001 1,602.7 1,273.3 36.6 292.8 1,636.7 1,235.6 66.0 335.2 1,570.8 908 2002 1,704.9 1,358.6 38.5 307.9 1,747.7 1,332.6 73.7 341.4 1,648.4 973 2003 1,847.7 1,499.0 33.5 315.2 1,889.2 1,460.9 82.5 345.8 1,678.7 1,086 2004 1,955.8 1,610.5 42.3 303.0 2,070.1 1,613.4 90.4 366.2 1,841.9 1,203 2005 2,068.3 1,715.8 41.1 311.4 2,155.3 1,682.0 84.0 389.3 1,931.4 1,283 2006 1,800.9 1,465.4 42.7 292.8 1,838.9 1,378.2 76.6 384.1 1,979.4 1,051 2007 1,355.0 1,046.0 31.7 277.3 1,398.4 979.9 59.6 359.0 1,502.8 776 2008 905.5 622.0 17.5 266.0 905.4 575.6 34.4 295.4 1,119.7 485 2009 554.0 445.1 11.6 97.3 583.0 441.1 20.7 121.1 794.4 375 2010 586.9 471.2 11.4 104.3 604.6 447.3 22.0 135.3 651.7 323 2011 608.8 430.6 10.9 167.3 624.1 418.5 21.6 184.0 584.9 306 2012 780.6 535.3 11.4 233.9 829.7 518.7 25.9 285.1 649.2 368 2013 p 926.7 618.3 13.8 294.6 976.4 617.5 26.6 332.3 765.1 428 2012: Jan 723 513 194 714 461 22 231 540 338 Feb 713 462 243 739 486 26 227 566 366 Mar 707 483 214 785 477 23 285 588 349 Apr 754 505 240 749 484 23 242 667 352 May 711 515 181 806 499 23 284 613 369 June 757 530 219 785 501 24 260 628 360 July 741 512 217 839 520 29 290 673 369 Aug 749 537 205 827 520 28 279 686 374 Sept 854 591 254 921 559 29 333 651 384 Oct 864 595 252 908 570 26 312 741 365 Nov 842 576 256 933 574 29 330 677 398 Dec 983 620 345 943 584 30 329 672 396 2013: Jan 898 614 273 915 588 26 301 720 458 Feb 969 652 307 952 600 31 321 727 445 Mar 1,005 623 356 890 599 25 266 810 443 Apr 852 593 244 1,005 614 25 366 698 446 May 919 597 311 985 620 27 338 711 429 June 835 605 219 918 625 26 267 759 450 July 891 587 285 954 609 27 318 783 373 Aug 883 620 251 926 627 23 276 765 388 Sept 873 580 283 974 615 28 331 762 403 Oct 899 600 289 1,039 621 27 391 814 452 Nov 1,101 713 379 1,017 641 24 352 826 444 Dec p 1,048 681 344 991 610 26 355 778 427 2014: Jan p 880 573 300 945 599 27 319 814 468 1 Authorized by issuance of local building permits in permit-issuing places: 20,000 places beginning with 2004; 19,000 for 1994–2003; 17,000 for 1984–93; 16,000 for 1978–83; 14,000 for 1972–77; and 13,000 for 1970–71. 2 Monthly data do not meet publication standards because tests for identifiable and stable seasonality do not meet reliability standards. Note: One-unit estimates prior to 1999, for new housing units started and completed and for new houses sold, include an upward adjustment of 3.3 percent to account for structures in permit-issuing areas that did not have permit authorization. Source: Department of Commerce (Bureau of the Census). GDP, Income, Prices, and Selected Indicators | 375
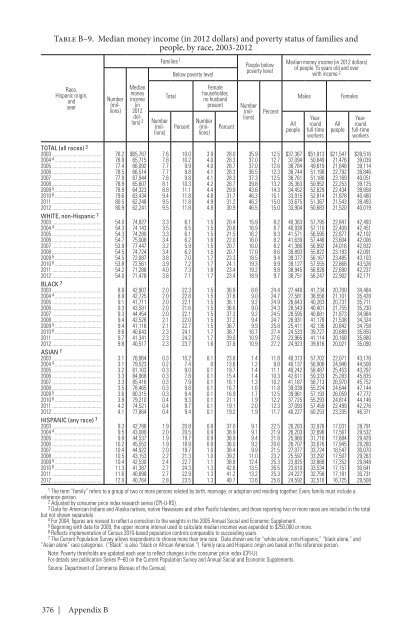
Table B–9. Median money income (in 2012 dollars) and poverty status of families and people, by race, 2003-2012 Families 1 Below poverty level People below poverty level Median money income (in 2012 dollars) of people 15 years old and over with income 2 Race, Hispanic origin, and year Number (millions) Median money income (in 2012 dollars) 2 Number (millions) Total Percent Female householder, no husband present Percent Number (millions) Percent All people Males Number (millions) Yearround full-time workers All people Females Yearround full-time workers TOTAL (all races) 3 2003 76.2 $65,767 7.6 10.0 3.9 28.0 35.9 12.5 $37,367 $51,813 $21,547 $39,516 2004 4 76.9 65,715 7.8 10.2 4.0 28.3 37.0 12.7 37,094 50,649 21,476 39,039 2005 77.4 66,092 7.7 9.9 4.0 28.7 37.0 12.6 36,784 49,619 21,848 39,114 2006 78.5 66,514 7.7 9.8 4.1 28.3 36.5 12.3 36,744 51,198 22,792 39,846 2007 77.9 67,944 7.6 9.8 4.1 28.3 37.3 12.5 36,761 51,188 23,169 40,051 2008 78.9 65,607 8.1 10.3 4.2 28.7 39.8 13.2 35,363 50,952 22,253 39,125 2009 5 78.9 64,323 8.8 11.1 4.4 29.9 43.6 14.3 34,452 52,629 22,434 39,858 2010 6 79.6 63,434 9.4 11.8 4.8 31.7 46.3 15.1 33,915 52,814 21,878 40,480 2011 80.5 62,248 9.5 11.8 4.9 31.2 46.2 15.0 33,675 51,367 21,543 39,493 2012 80.9 62,241 9.5 11.8 4.8 30.9 46.5 15.0 33,904 50,683 21,520 40,019 WHITE, non-Hispanic 7 2003 54.0 74,827 3.3 6.1 1.5 20.4 15.9 8.2 40,363 57,795 22,847 42,493 2004 4 54.3 74,143 3.5 6.5 1.5 20.8 16.9 8.7 40,938 57,110 22,409 42,451 2005 54.3 74,280 3.3 6.1 1.5 21.5 16.2 8.3 41,571 56,595 22,877 42,102 2006 54.7 75,008 3.4 6.2 1.6 22.0 16.0 8.2 41,639 57,446 23,604 42,006 2007 53.9 77,447 3.2 5.9 1.5 20.7 16.0 8.2 41,386 56,992 24,016 42,832 2008 54.5 74,724 3.4 6.2 1.5 20.7 17.0 8.6 39,893 55,822 23,193 42,091 2009 5 54.5 72,087 3.8 7.0 1.7 23.3 18.5 9.4 39,377 56,167 23,485 43,103 2010 6 53.8 72,561 3.9 7.2 1.7 24.1 19.3 9.9 39,127 57,555 22,868 43,526 2011 54.2 71,288 4.0 7.3 1.8 23.4 19.2 9.8 38,945 56,928 22,690 42,237 2012 54.0 71,478 3.8 7.1 1.7 23.4 18.9 9.7 38,751 56,247 22,902 42,171 BLACK 7 2003 8.9 42,907 2.0 22.3 1.5 36.9 8.8 24.4 27,448 41,734 20,700 34,484 2004 4 8.9 42,725 2.0 22.8 1.5 37.6 9.0 24.7 27,581 38,558 21,101 35,428 2005 9.1 41,711 2.0 22.1 1.5 36.1 9.2 24.9 26,643 40,263 20,737 35,711 2006 9.3 43,581 2.0 21.6 1.5 36.6 9.0 24.3 28,543 40,401 21,755 35,230 2007 9.3 44,454 2.0 22.1 1.5 37.3 9.2 24.5 28,595 40,681 21,873 34,984 2008 9.4 42,528 2.1 22.0 1.5 37.2 9.4 24.7 26,931 41,176 21,538 34,324 2009 5 9.4 41,116 2.1 22.7 1.5 36.7 9.9 25.8 25,411 42,136 20,842 34,758 2010 6 9.6 40,643 2.3 24.1 1.7 38.7 10.7 27.4 24,533 39,727 20,689 35,850 2011 9.7 41,341 2.3 24.2 1.7 39.0 10.9 27.6 23,965 41,114 20,168 35,880 2012 9.8 40,517 2.3 23.7 1.6 37.8 10.9 27.2 24,923 39,816 20,021 35,090 ASIAN 7 2003 3.1 78,964 0.3 10.2 0.1 23.8 1.4 11.8 40,313 57,702 22,071 43,176 2004 4 3.1 79,523 0.2 7.4 .0 13.6 1.2 9.8 40,137 56,906 24,946 44,508 2005 3.2 81,103 0.3 9.0 0.1 19.7 1.4 11.1 40,242 58,487 25,453 43,297 2006 3.3 84,968 0.3 7.8 0.1 15.4 1.4 10.3 42,611 59,333 25,283 45,835 2007 3.3 85,416 0.3 7.9 0.1 16.1 1.3 10.2 41,187 56,713 26,970 45,752 2008 3.5 78,465 0.3 9.8 0.1 16.7 1.6 11.8 39,038 55,224 24,644 47,144 2009 5 3.6 80,315 0.3 9.4 0.1 16.9 1.7 12.5 39,961 57,193 26,059 47,772 2010 6 3.9 79,210 0.4 9.3 0.1 21.1 1.9 12.2 37,725 55,293 24,814 44,146 2011 4.2 74,521 0.4 9.7 0.1 19.1 2.0 12.3 37,093 57,459 22,499 42,276 2012 4.1 77,864 0.4 9.4 0.1 19.2 1.9 11.7 40,227 60,253 23,335 46,371 HISPANIC (any race) 7 2003 9.3 42,786 1.9 20.8 0.8 37.0 9.1 22.5 26,283 32,976 17,031 28,791 2004 4 9.5 43,080 2.0 20.5 0.9 38.9 9.1 21.9 26,203 32,696 17,567 29,532 2005 9.9 44,537 1.9 19.7 0.9 38.9 9.4 21.8 25,980 31,716 17,684 29,429 2006 10.2 45,552 1.9 18.9 0.9 36.0 9.2 20.6 26,707 33,676 17,945 29,260 2007 10.4 44,922 2.0 19.7 1.0 38.4 9.9 21.5 27,077 33,724 18,547 30,070 2008 10.5 43,153 2.2 21.3 1.0 39.2 11.0 23.2 25,597 33,292 17,507 29,263 2009 5 10.4 42,530 2.4 22.7 1.1 38.8 12.4 25.3 23,825 33,868 17,352 29,848 2010 6 11.3 41,387 2.7 24.3 1.3 42.6 13.5 26.5 23,610 33,534 17,157 30,641 2011 11.6 40,898 2.7 22.9 1.3 41.2 13.2 25.3 24,227 32,758 17,181 30,731 2012 12.0 40,764 2.8 23.5 1.3 40.7 13.6 25.6 24,592 32,516 16,725 29,508 1 The term “family” refers to a group of two or more persons related by birth, marriage, or adoption and residing together. Every family must include a reference person. 2 Adjusted by consumer price index research series (CPI-U-RS). 3 Data for American Indians and Alaska natives, native Hawaiians and other Pacific Islanders, and those reporting two or more races are included in the total but not shown separately. 4 For 2004, figures are revised to reflect a correction to the weights in the 2005 Annual Social and Economic Supplement. 5 Beginning with data for 2009, the upper income interval used to calculate median incomes was expanded to $250,000 or more. 6 Reflects implementation of Census 2010-based population controls comparable to succeeding years. 7 The Current Population Survey allows respondents to choose more than one race. Data shown are for “white alone, non-Hispanic,” “black alone,” and “Asian alone” race categories. (“Black” is also “black or African American.”) Family race and Hispanic origin are based on the reference person. Note: Poverty thresholds are updated each year to reflect changes in the consumer price index (CPI-U). For details see publication Series P–60 on the Current Population Survey and Annual Social and Economic Supplements. Source: Department of Commerce (Bureau of the Census). 376 | Appendix B
- Page 1 and 2:
ECONOMIC REPORT OF THE PRESIDENT To
- Page 4:
C O N T E N T S ECONOMIC REPORT OF
- Page 8 and 9:
economic report of the president To
- Page 10 and 11:
year-old. In the meantime, I’m go
- Page 12:
the annual report of the council of
- Page 16 and 17:
C O N T E N T S CHAPTER 1. PROMOTIN
- Page 18 and 19:
APPENDIX 1: COMPONENTS OF THE RECOV
- Page 20 and 21:
THE OBAMA ADMINISTRATION’S RECORD
- Page 22 and 23:
2.15. Housing Starts, 1960-2013....
- Page 24 and 25:
3.1. Forecasted and Actual Real GDP
- Page 26 and 27:
C H A P T E R 1 PROMOTING OPPORTUNI
- Page 28 and 29:
Opportunity, Growth, and Security i
- Page 30 and 31:
crisis—continue to rebound and co
- Page 32 and 33:
Figure 1-4 Real GDP Per Working-Age
- Page 34 and 35:
Figure 1-6 Change in Poverty Rate F
- Page 36 and 37:
Figure 1-7 Domestic Crude Oil Produ
- Page 38 and 39:
Figure 1-8 Growth in Real Per Capit
- Page 40 and 41:
Figure 1-9 Unemployment Rate by Dur
- Page 42 and 43:
e needed to make up for a decades-l
- Page 44 and 45:
Annual percent change 2.50 15-year
- Page 46 and 47:
Figure 1-14 Share of National Incom
- Page 48:
Along with steps that create jobs,
- Page 51 and 52:
corner, with purchases increasing d
- Page 53 and 54:
the four quarters of 2013, or enoug
- Page 55 and 56:
Percent of GDP 12 10 8 6 4 2 0 -2 -
- Page 57 and 58:
Percent 5.0 4.0 3.0 2.0 Figure 2-3
- Page 59 and 60:
In the euro area, the unemployment
- Page 61 and 62:
Figure 2-6 Cumulative Flows into Mu
- Page 63 and 64:
Figure 2-7 Household Deleveraging,
- Page 65 and 66:
Box 2-1: The 2013 Comprehensive Rev
- Page 67 and 68:
Percent 25 20 15 10 5 0 -5 Figure 2
- Page 69 and 70:
Figure 2-11 State and Local Pension
- Page 71 and 72:
Percent of GDP 2 1 0 Figure 2-14 Cu
- Page 73 and 74:
Box 2-2. Administration Trade Polic
- Page 75 and 76:
Upon completion, the TPP and T-TIP
- Page 77 and 78:
percent of households report that i
- Page 79 and 80:
Figure 2-18 Petroleum Net Imports,
- Page 81 and 82:
Figure 2-21 U.S. Per Capita Consump
- Page 83 and 84:
Percent 11 Figure 2-22 Unemployment
- Page 85 and 86:
Figure 2-25 Predicted vs. Actual Ma
- Page 87 and 88:
Box 2-4: Unemployment Duration and
- Page 89 and 90:
The Long-Term Outlook The 11-Year F
- Page 91 and 92:
Growth in GDP over the Long Term As
- Page 93 and 94:
Box 2-5: Immigration Reform and Pot
- Page 95 and 96:
Even with this growth, however, the
- Page 97 and 98:
families. The other half was for in
- Page 99 and 100:
ecause of rapidly declining stock a
- Page 101 and 102:
Obama Administration and the 111th
- Page 103 and 104:
Figure 3-1 Recovery Act Programs by
- Page 105 and 106:
other cases, new measures expanded
- Page 107 and 108:
Figure 3-2 Recovery Act and Subsequ
- Page 109 and 110:
Box 3-1: Other Administration Polic
- Page 111 and 112:
challenges, and how economists have
- Page 113 and 114:
Table 3-5 Estimated Output Multipli
- Page 115 and 116:
Figure 3-7 Quarterly Effect of the
- Page 117 and 118:
Table 3-6 Estimates of the Effects
- Page 119 and 120:
International Comparison The 2008 c
- Page 121 and 122:
Box 3-2: The U.S. Recovery in Compa
- Page 123 and 124:
Table 3-7 Tax Relief and Income Sup
- Page 125 and 126:
traditionally been jointly financed
- Page 127 and 128:
downturn in the economy. Even thoug
- Page 129 and 130:
Figure 3-11 Recovery Act Cumulative
- Page 131 and 132:
The Recovery Act also invested in r
- Page 133 and 134:
helped individuals who chose to ret
- Page 135 and 136:
the period, even though total power
- Page 137 and 138:
average—then the resulting increa
- Page 139 and 140:
Alternative Minimum Tax relief, bus
- Page 141 and 142:
Through the end of a Individual Tax
- Page 143 and 144:
y Poterba (1994), states and locali
- Page 145 and 146:
Table 3-11 Fiscal Support for the E
- Page 147 and 148:
spells. Because the resulting unemp
- Page 149 and 150:
literature uses two different appro
- Page 151 and 152:
Table 3-12 Summary of Cross-Section
- Page 153 and 154:
the CMS projections show real per-c
- Page 155 and 156:
will accrue to workers as higher wa
- Page 157 and 158:
Box 4-1: Two Measures of Growth in
- Page 159 and 160:
Figure 4-1 Growth in Real Per Capit
- Page 161 and 162:
in particular may not exactly track
- Page 163 and 164:
find that even those seniors who di
- Page 165 and 166:
the slowdown in real (that is, infl
- Page 167 and 168:
health care costs for an individual
- Page 169 and 170:
estimate for the ACA found that its
- Page 171 and 172:
Figure 4-4 Medicare 30-Day, All-Con
- Page 173 and 174:
agreements among the providers them
- Page 175 and 176:
payment for physician services, the
- Page 177 and 178:
Box 4-3: The Cost Slowdown and ACA
- Page 179 and 180:
2010a; 2011; 2012c; 2013a; 2014), w
- Page 181 and 182:
Figure 4-6 Recent CBO Projections o
- Page 183 and 184:
Conclusion The evidence is clear th
- Page 185 and 186:
facilitated this private-sector tec
- Page 187 and 188:
esulting gap between the actual gro
- Page 189 and 190:
Table 5-1 Sources of Productivity I
- Page 191 and 192:
Table 5-2 Nonfarm Private Business
- Page 193 and 194:
of the productivity improvement res
- Page 195 and 196:
Figure 5-3 Growth in Productivity a
- Page 197 and 198:
improving and college completion ra
- Page 199 and 200:
Box 5-2: Does Inequality Affect Pro
- Page 201 and 202:
Percent 3.5 Figure 5-5 Composition
- Page 203 and 204:
• Just two of the largest U.S. te
- Page 205 and 206:
Box 5-3: Just-in-Time Manufacturing
- Page 207 and 208:
Figure 5-7 Exclusive and Shared All
- Page 209 and 210:
Box 5-4: Spectrum Investment Polici
- Page 211 and 212:
To stimulate investment in more adv
- Page 213 and 214:
Because current uses of technology
- Page 215 and 216:
Box 5-5: Electronic Health Records
- Page 217 and 218:
about the array of services and sup
- Page 219 and 220:
and, in such cases, provides partie
- Page 221 and 222:
Box 5-6: The Leahy-Smith America In
- Page 223 and 224:
Box 5-7: Pay-For-Delay Settlements
- Page 226 and 227:
C H A P T E R 6 THE WAR ON POVERTY
- Page 228 and 229:
Measuring Poverty: Who is Poor in A
- Page 230 and 231:
thresholds ever since. These dollar
- Page 232 and 233:
of necessary items, including food,
- Page 234 and 235:
Table 6-1 Poverty Rates by Selected
- Page 236 and 237:
Box 6-3: Women and Poverty While wo
- Page 238 and 239:
However, this reflects smaller decl
- Page 240 and 241:
Percent 25 Figure 6-1 Trends in the
- Page 242 and 243:
Box 6-4: Social Programs Serve All
- Page 244 and 245:
of low- and middle-income workers a
- Page 246 and 247:
particularly valuable since they es
- Page 248 and 249:
Figure 6-4 Official vs Anchored Sup
- Page 250 and 251:
deep market poverty driven by the b
- Page 252 and 253:
work: in 2010, for example, unemplo
- Page 254 and 255:
out of poverty through job training
- Page 256 and 257:
e noted that researchers have found
- Page 258 and 259:
2012). Among the children of low-ea
- Page 260 and 261:
Education appears to be one of the
- Page 262 and 263:
Friedman, and Rockoff (2011) find t
- Page 264 and 265:
including an additional $25 a week
- Page 266 and 267:
Figure 6-11 Recovery Act and Subseq
- Page 268 and 269:
Empowering Every Child with a Quali
- Page 270 and 271:
modernize America’s high schools
- Page 272 and 273:
low-income Americans and their chil
- Page 274 and 275:
C H A P T E R 7 EVALUATION AS A TOO
- Page 276 and 277:
program evaluation efforts. For exa
- Page 278 and 279:
went to preschool would have had if
- Page 280 and 281:
y adopting successful interventions
- Page 282 and 283:
Box 7-2: Using Behavioral Economics
- Page 284 and 285:
Box 7-3: “Rapid Cycle” Evaluati
- Page 286 and 287:
Figure 7-1 Outlays for Grants to St
- Page 288 and 289:
performance data, fewer than half o
- Page 290 and 291:
Investment Act programs. The PROMIS
- Page 292 and 293:
Figure 7-2 Inventory of Beds for Ho
- Page 294 and 295:
example, included a nondiscretionar
- Page 296 and 297:
Other benefits of considering evalu
- Page 298 and 299:
with the treatment effect and thus
- Page 300 and 301:
unemployment insurance wage and ben
- Page 302 and 303:
hard for researchers to access for
- Page 304 and 305:
REFERENCES Chapter 1 Almunia, Migue
- Page 306 and 307:
____. 2014. “Press Release: Janua
- Page 308 and 309:
and the TPP at the Peterson Institu
- Page 310 and 311:
Increase Employment Evidence from t
- Page 312 and 313:
___. 2010b. “The Economic Impact
- Page 314 and 315:
___. 2012. World Economic Outlook A
- Page 316 and 317:
Polak Annual Research Conference. W
- Page 318 and 319:
Baicker, Katherine and Amitabh Chan
- Page 320 and 321:
Daly, Mary, Bart Hobijn, and Brian
- Page 322 and 323:
Nominal Wages,” International Jou
- Page 324 and 325:
Learning: A Meta-Analysis and Revie
- Page 326 and 327:
Chien, Colleen V. 2012. “Reformin
- Page 328 and 329:
GAO (Government Accountability Offi
- Page 330 and 331: Jorgenson, Dale. 2001. “Informati
- Page 332 and 333: Integration in Economic Development
- Page 334 and 335: _____. 2007. “Improving the Safet
- Page 336 and 337: Dahl, Gordon B. and Lance Lochner.
- Page 338 and 339: Heckman, James J. and Dimitriy V. M
- Page 340 and 341: Ludwig, Jens and Douglas Miller. 20
- Page 342 and 343: Sharkey, Patrick. 2009. “Neighbor
- Page 344 and 345: _____. 2013. “Practical Evaluatio
- Page 346 and 347: www.nij.gov/topics/corrections/comm
- Page 348: Stock, James H., and Mark Watson. 2
- Page 352 and 353: letter of transmittal Council of Ec
- Page 354: Council Members and Their Dates of
- Page 357 and 358: The Members of the Council Betsey S
- Page 359 and 360: Act has had on reducing health care
- Page 361 and 362: Statistical Office The Statistical
- Page 364: A P P E N D I X B STATISTICAL TABLE
- Page 367 and 368: INTEREST RATES, MONEY STOCK, AND GO
- Page 369 and 370: 2013-to-2014 TABLE NUMBER MATCH 201
- Page 371 and 372: Year or quarter Table B-1. Percent
- Page 373 and 374: Table B-2. Gross domestic product,
- Page 375 and 376: Table B-3. Quantity and price index
- Page 377 and 378: Table B-5. Real exports and imports
- Page 379: Year Total 2 Table B-7. Real farm i
- Page 383 and 384: Year or month Civilian noninstituti
- Page 385 and 386: Year or month All civilian workers
- Page 387 and 388: Table B-14. Employees on nonagricul
- Page 389 and 390: Table B-15. Hours and earnings in p
- Page 391 and 392: Year and month Interest Rates, Mone
- Page 393 and 394: Year and month Table B-18. Money st
- Page 395 and 396: Table B-20. Federal receipts, outla
- Page 397 and 398: Table B-22. Federal receipts, outla
- Page 399 and 400: Table B-24. State and local governm
- Page 401 and 402: End of month Table B-26. Estimated
- Page 403 and 404: B-7. Chain-type price indexes for g
- Page 405 and 406: B-28. National income by type of in
- Page 407 and 408: B-48. Employment cost index, privat
- Page 409 and 410: B-65. Producer price indexes by sta
- Page 411 and 412: B-81. Federal receipts, outlays, su
- Page 413 and 414: B-99. Farm output and productivity
- Page 415: B-111. International reserves Inter