

1fAWAwx
1fAWAwx
1fAWAwx

Create successful ePaper yourself
Turn your PDF publications into a flip-book with our unique Google optimized e-Paper software.
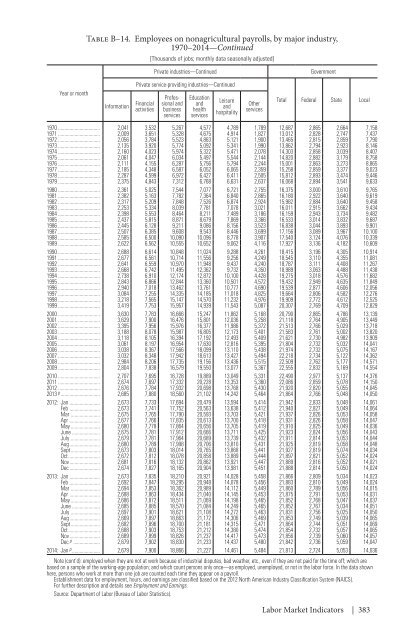
Table B–14. Employees on nonagricultural payrolls, by major industry,<br />
1970–2014—Continued<br />
[Thousands of jobs; monthly data seasonally adjusted]<br />
Private industries—Continued<br />
Government<br />
Year or month<br />
Information<br />
Private service-providing industries—Continued<br />
Financial<br />
activities<br />
Professional<br />
and<br />
business<br />
services<br />
Education<br />
and<br />
health<br />
services<br />
Leisure<br />
and<br />
hospitality<br />
Other<br />
services<br />
Total Federal State Local<br />
1970 2,041 3,532 5,267 4,577 4,789 1,789 12,687 2,865 2,664 7,158<br />
1971 2,009 3,651 5,328 4,675 4,914 1,827 13,012 2,828 2,747 7,437<br />
1972 2,056 3,784 5,523 4,863 5,121 1,900 13,465 2,815 2,859 7,790<br />
1973 2,135 3,920 5,774 5,092 5,341 1,990 13,862 2,794 2,923 8,146<br />
1974 2,160 4,023 5,974 5,322 5,471 2,078 14,303 2,858 3,039 8,407<br />
1975 2,061 4,047 6,034 5,497 5,544 2,144 14,820 2,882 3,179 8,758<br />
1976 2,111 4,155 6,287 5,756 5,794 2,244 15,001 2,863 3,273 8,865<br />
1977 2,185 4,348 6,587 6,052 6,065 2,359 15,258 2,859 3,377 9,023<br />
1978 2,287 4,599 6,972 6,427 6,411 2,505 15,812 2,893 3,474 9,446<br />
1979 2,375 4,843 7,312 6,768 6,631 2,637 16,068 2,894 3,541 9,633<br />
1980 2,361 5,025 7,544 7,077 6,721 2,755 16,375 3,000 3,610 9,765<br />
1981 2,382 5,163 7,782 7,364 6,840 2,865 16,180 2,922 3,640 9,619<br />
1982 2,317 5,209 7,848 7,526 6,874 2,924 15,982 2,884 3,640 9,458<br />
1983 2,253 5,334 8,039 7,781 7,078 3,021 16,011 2,915 3,662 9,434<br />
1984 2,398 5,553 8,464 8,211 7,489 3,186 16,159 2,943 3,734 9,482<br />
1985 2,437 5,815 8,871 8,679 7,869 3,366 16,533 3,014 3,832 9,687<br />
1986 2,445 6,128 9,211 9,086 8,156 3,523 16,838 3,044 3,893 9,901<br />
1987 2,507 6,385 9,608 9,543 8,446 3,699 17,156 3,089 3,967 10,100<br />
1988 2,585 6,500 10,090 10,096 8,778 3,907 17,540 3,124 4,076 10,339<br />
1989 2,622 6,562 10,555 10,652 9,062 4,116 17,927 3,136 4,182 10,609<br />
1990 2,688 6,614 10,848 11,024 9,288 4,261 18,415 3,196 4,305 10,914<br />
1991 2,677 6,561 10,714 11,556 9,256 4,249 18,545 3,110 4,355 11,081<br />
1992 2,641 6,559 10,970 11,948 9,437 4,240 18,787 3,111 4,408 11,267<br />
1993 2,668 6,742 11,495 12,362 9,732 4,350 18,989 3,063 4,488 11,438<br />
1994 2,738 6,910 12,174 12,872 10,100 4,428 19,275 3,018 4,576 11,682<br />
1995 2,843 6,866 12,844 13,360 10,501 4,572 19,432 2,949 4,635 11,849<br />
1996 2,940 7,018 13,462 13,761 10,777 4,690 19,539 2,877 4,606 12,056<br />
1997 3,084 7,255 14,335 14,185 11,018 4,825 19,664 2,806 4,582 12,276<br />
1998 3,218 7,565 15,147 14,570 11,232 4,976 19,909 2,772 4,612 12,525<br />
1999 3,419 7,753 15,957 14,939 11,543 5,087 20,307 2,769 4,709 12,829<br />
2000 3,630 7,783 16,666 15,247 11,862 5,168 20,790 2,865 4,786 13,139<br />
2001 3,629 7,900 16,476 15,801 12,036 5,258 21,118 2,764 4,905 13,449<br />
2002 3,395 7,956 15,976 16,377 11,986 5,372 21,513 2,766 5,029 13,718<br />
2003 3,188 8,078 15,987 16,805 12,173 5,401 21,583 2,761 5,002 13,820<br />
2004 3,118 8,105 16,394 17,192 12,493 5,409 21,621 2,730 4,982 13,909<br />
2005 3,061 8,197 16,954 17,630 12,816 5,395 21,804 2,732 5,032 14,041<br />
2006 3,038 8,367 17,566 18,099 13,110 5,438 21,974 2,732 5,075 14,167<br />
2007 3,032 8,348 17,942 18,613 13,427 5,494 22,218 2,734 5,122 14,362<br />
2008 2,984 8,206 17,735 19,156 13,436 5,515 22,509 2,762 5,177 14,571<br />
2009 2,804 7,838 16,579 19,550 13,077 5,367 22,555 2,832 5,169 14,554<br />
2010 2,707 7,695 16,728 19,889 13,049 5,331 22,490 2,977 5,137 14,376<br />
2011 2,674 7,697 17,332 20,228 13,353 5,360 22,086 2,859 5,078 14,150<br />
2012 2,676 7,784 17,932 20,698 13,768 5,430 21,920 2,820 5,055 14,045<br />
2013 p 2,685 7,880 18,560 21,102 14,242 5,464 21,864 2,766 5,048 14,050<br />
2012: Jan 2,673 7,733 17,694 20,479 13,594 5,414 21,942 2,833 5,048 14,061<br />
Feb 2,673 7,741 17,752 20,563 13,638 5,412 21,940 2,827 5,049 14,064<br />
Mar 2,675 7,765 17,790 20,593 13,703 5,421 21,937 2,826 5,053 14,058<br />
Apr 2,677 7,766 17,835 20,613 13,700 5,418 21,931 2,826 5,058 14,047<br />
May 2,680 7,778 17,864 20,656 13,705 5,419 21,910 2,825 5,049 14,036<br />
June 2,675 7,781 17,912 20,666 13,711 5,425 21,923 2,824 5,056 14,043<br />
July 2,679 7,781 17,964 20,689 13,739 5,432 21,911 2,814 5,053 14,044<br />
Aug 2,680 7,789 17,998 20,706 13,810 5,431 21,925 2,819 5,058 14,048<br />
Sept 2,673 7,803 18,014 20,765 13,868 5,441 21,927 2,819 5,074 14,034<br />
Oct 2,672 7,812 18,078 20,858 13,889 5,444 21,897 2,821 5,052 14,024<br />
Nov 2,681 7,816 18,132 20,862 13,921 5,447 21,889 2,816 5,052 14,021<br />
Dec 2,674 7,827 18,165 20,904 13,981 5,451 21,888 2,814 5,050 14,024<br />
2013: Jan 2,673 7,835 18,210 20,921 14,028 5,458 21,866 2,809 5,034 14,023<br />
Feb 2,692 7,847 18,295 20,948 14,078 5,456 21,883 2,810 5,049 14,024<br />
Mar 2,694 7,853 18,362 20,989 14,112 5,449 21,860 2,789 5,056 14,015<br />
Apr 2,688 7,863 18,434 21,040 14,145 5,453 21,875 2,791 5,053 14,031<br />
May 2,686 7,872 18,511 21,069 14,198 5,465 21,852 2,768 5,047 14,037<br />
June 2,685 7,885 18,570 21,084 14,249 5,465 21,852 2,767 5,034 14,051<br />
July 2,697 7,901 18,621 21,108 14,272 5,463 21,831 2,756 5,025 14,050<br />
Aug 2,669 7,897 18,663 21,172 14,306 5,469 21,853 2,749 5,039 14,065<br />
Sept 2,682 7,896 18,700 21,181 14,315 5,471 21,864 2,744 5,051 14,069<br />
Oct 2,688 7,903 18,753 21,212 14,380 5,474 21,854 2,732 5,057 14,065<br />
Nov 2,689 7,899 18,826 21,237 14,417 5,473 21,856 2,739 5,060 14,057<br />
Dec p 2,679 7,902 18,830 21,233 14,437 5,480 21,842 2,736 5,059 14,047<br />
2014: Jan p 2,679 7,900 18,866 21,227 14,461 5,484 21,813 2,724 5,053 14,036<br />
Note (cont’d): employed when they are not at work because of industrial disputes, bad weather, etc., even if they are not paid for the time off; which are<br />
based on a sample of the working-age population; and which count persons only once—as employed, unemployed, or not in the labor force. In the data shown<br />
here, persons who work at more than one job are counted each time they appear on a payroll.<br />
Establishment data for employment, hours, and earnings are classified based on the 2012 North American Industry Classification System (NAICS).<br />
For further description and details see Employment and Earnings.<br />
Source: Department of Labor (Bureau of Labor Statistics).<br />
Labor Market Indicators | 383