

1fAWAwx
1fAWAwx
1fAWAwx

You also want an ePaper? Increase the reach of your titles
YUMPU automatically turns print PDFs into web optimized ePapers that Google loves.
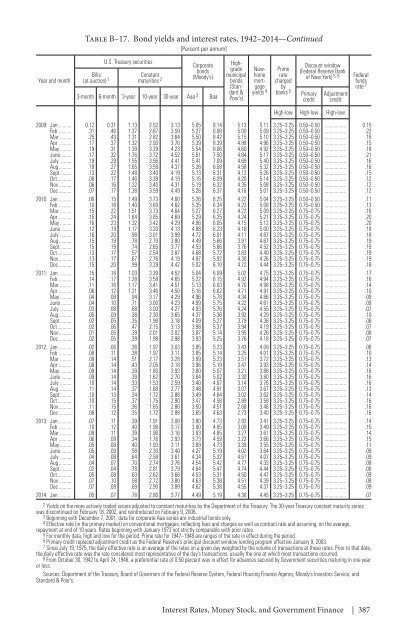
Table B–17. Bond yields and interest rates, 1942–2014—Continued<br />
[Percent per annum]<br />
Year and month<br />
Bills<br />
(at auction) 1<br />
U.S. Treasury securities<br />
Constant<br />
maturities 2<br />
Corporate<br />
bonds<br />
(Moody’s)<br />
3-month 6-month 3-year 10-year 30-year Aaa 3 Baa<br />
Highgrade<br />
municipal<br />
bonds<br />
(Standard<br />
&<br />
Poor’s)<br />
Newhome<br />
mortgage<br />
yields 4<br />
Prime<br />
rate<br />
charged<br />
by<br />
banks 5<br />
Discount window<br />
(Federal Reserve Bank<br />
of New York) 5, 6<br />
Primary<br />
credit<br />
Adjustment<br />
credit<br />
Federal<br />
funds<br />
rate 7<br />
High-low High-low High-low<br />
2009: Jan 0.12 0.31 1.13 2.52 3.13 5.05 8.14 5.13 5.11 3.25–3.25 0.50–0.50 0.15<br />
Feb .31 .46 1.37 2.87 3.59 5.27 8.08 5.00 5.09 3.25–3.25 0.50–0.50 .22<br />
Mar .25 .43 1.31 2.82 3.64 5.50 8.42 5.15 5.10 3.25–3.25 0.50–0.50 .18<br />
Apr .17 .37 1.32 2.93 3.76 5.39 8.39 4.88 4.96 3.25–3.25 0.50–0.50 .15<br />
May .19 .31 1.39 3.29 4.23 5.54 8.06 4.60 4.92 3.25–3.25 0.50–0.50 .18<br />
June .17 .32 1.76 3.72 4.52 5.61 7.50 4.84 5.17 3.25–3.25 0.50–0.50 .21<br />
July .19 .29 1.55 3.56 4.41 5.41 7.09 4.69 5.40 3.25–3.25 0.50–0.50 .16<br />
Aug .18 .27 1.65 3.59 4.37 5.26 6.58 4.58 5.32 3.25–3.25 0.50–0.50 .16<br />
Sept .13 .22 1.48 3.40 4.19 5.13 6.31 4.13 5.26 3.25–3.25 0.50–0.50 .15<br />
Oct .08 .17 1.46 3.39 4.19 5.15 6.29 4.20 5.14 3.25–3.25 0.50–0.50 .12<br />
Nov .06 .16 1.32 3.40 4.31 5.19 6.32 4.35 5.08 3.25–3.25 0.50–0.50 .12<br />
Dec .07 .17 1.38 3.59 4.49 5.26 6.37 4.16 5.01 3.25–3.25 0.50–0.50 .12<br />
2010: Jan .06 .15 1.49 3.73 4.60 5.26 6.25 4.22 5.04 3.25–3.25 0.50–0.50 .11<br />
Feb .10 .18 1.40 3.69 4.62 5.35 6.34 4.23 5.08 3.25–3.25 0.75–0.50 .13<br />
Mar .15 .22 1.51 3.73 4.64 5.27 6.27 4.22 5.09 3.25–3.25 0.75–0.75 .16<br />
Apr .15 .24 1.64 3.85 4.69 5.29 6.25 4.24 5.21 3.25–3.25 0.75–0.75 .20<br />
May .16 .23 1.32 3.42 4.29 4.96 6.05 4.15 5.12 3.25–3.25 0.75–0.75 .20<br />
June .12 .19 1.17 3.20 4.13 4.88 6.23 4.18 5.00 3.25–3.25 0.75–0.75 .18<br />
July .16 .20 .98 3.01 3.99 4.72 6.01 4.11 4.87 3.25–3.25 0.75–0.75 .18<br />
Aug .15 .19 .78 2.70 3.80 4.49 5.66 3.91 4.67 3.25–3.25 0.75–0.75 .19<br />
Sept .15 .19 .74 2.65 3.77 4.53 5.66 3.76 4.52 3.25–3.25 0.75–0.75 .19<br />
Oct .13 .17 .57 2.54 3.87 4.68 5.72 3.83 4.40 3.25–3.25 0.75–0.75 .19<br />
Nov .13 .17 .67 2.76 4.19 4.87 5.92 4.30 4.26 3.25–3.25 0.75–0.75 .19<br />
Dec .15 .20 .99 3.29 4.42 5.02 6.10 4.72 4.44 3.25–3.25 0.75–0.75 .18<br />
2011: Jan .15 .18 1.03 3.39 4.52 5.04 6.09 5.02 4.75 3.25–3.25 0.75–0.75 .17<br />
Feb .14 .17 1.28 3.58 4.65 5.22 6.15 4.92 4.94 3.25–3.25 0.75–0.75 .16<br />
Mar .11 .16 1.17 3.41 4.51 5.13 6.03 4.70 4.98 3.25–3.25 0.75–0.75 .14<br />
Apr .06 .12 1.21 3.46 4.50 5.16 6.02 4.71 4.91 3.25–3.25 0.75–0.75 .10<br />
May .04 .08 .94 3.17 4.29 4.96 5.78 4.34 4.86 3.25–3.25 0.75–0.75 .09<br />
June .04 .10 .71 3.00 4.23 4.99 5.75 4.22 4.61 3.25–3.25 0.75–0.75 .09<br />
July .03 .08 .68 3.00 4.27 4.93 5.76 4.24 4.55 3.25–3.25 0.75–0.75 .07<br />
Aug .05 .09 .38 2.30 3.65 4.37 5.36 3.92 4.29 3.25–3.25 0.75–0.75 .10<br />
Sept .02 .05 .35 1.98 3.18 4.09 5.27 3.79 4.36 3.25–3.25 0.75–0.75 .08<br />
Oct .02 .06 .47 2.15 3.13 3.98 5.37 3.94 4.19 3.25–3.25 0.75–0.75 .07<br />
Nov .01 .05 .39 2.01 3.02 3.87 5.14 3.95 4.26 3.25–3.25 0.75–0.75 .08<br />
Dec .02 .05 .39 1.98 2.98 3.93 5.25 3.76 4.18 3.25–3.25 0.75–0.75 .07<br />
2012: Jan .02 .06 .36 1.97 3.03 3.85 5.23 3.43 4.09 3.25–3.25 0.75–0.75 .08<br />
Feb .08 .11 .38 1.97 3.11 3.85 5.14 3.25 4.01 3.25–3.25 0.75–0.75 .10<br />
Mar .09 .14 .51 2.17 3.28 3.99 5.23 3.51 3.72 3.25–3.25 0.75–0.75 .13<br />
Apr .08 .14 .43 2.05 3.18 3.96 5.19 3.47 3.93 3.25–3.25 0.75–0.75 .14<br />
May .09 .14 .39 1.80 2.93 3.80 5.07 3.21 3.88 3.25–3.25 0.75–0.75 .16<br />
June .09 .14 .39 1.62 2.70 3.64 5.02 3.30 3.80 3.25–3.25 0.75–0.75 .16<br />
July .10 .14 .33 1.53 2.59 3.40 4.87 3.14 3.76 3.25–3.25 0.75–0.75 .16<br />
Aug .11 .14 .37 1.68 2.77 3.48 4.91 3.07 3.67 3.25–3.25 0.75–0.75 .13<br />
Sept .10 .13 .34 1.72 2.88 3.49 4.84 3.02 3.62 3.25–3.25 0.75–0.75 .14<br />
Oct .10 .15 .37 1.75 2.90 3.47 4.58 2.89 3.58 3.25–3.25 0.75–0.75 .16<br />
Nov .11 .15 .36 1.65 2.80 3.50 4.51 2.68 3.46 3.25–3.25 0.75–0.75 .16<br />
Dec .08 .12 .35 1.72 2.88 3.65 4.63 2.73 3.40 3.25–3.25 0.75–0.75 .16<br />
2013: Jan .07 .11 .39 1.91 3.08 3.80 4.73 2.93 3.41 3.25–3.25 0.75–0.75 .14<br />
Feb .10 .12 .40 1.98 3.17 3.90 4.85 3.09 3.49 3.25–3.25 0.75–0.75 .15<br />
Mar .09 .11 .39 1.96 3.16 3.93 4.85 3.27 3.61 3.25–3.25 0.75–0.75 .14<br />
Apr .06 .09 .34 1.76 2.93 3.73 4.59 3.22 3.66 3.25–3.25 0.75–0.75 .15<br />
May .05 .08 .40 1.93 3.11 3.89 4.73 3.39 3.55 3.25–3.25 0.75–0.75 .11<br />
June .05 .09 .58 2.30 3.40 4.27 5.19 4.02 3.64 3.25–3.25 0.75–0.75 .09<br />
July .04 .08 .64 2.58 3.61 4.34 5.32 4.51 4.07 3.25–3.25 0.75–0.75 .09<br />
Aug .04 .07 .70 2.74 3.76 4.54 5.42 4.77 4.33 3.25–3.25 0.75–0.75 .08<br />
Sept .02 .04 .78 2.81 3.79 4.64 5.47 4.74 4.44 3.25–3.25 0.75–0.75 .08<br />
Oct .05 .08 .63 2.62 3.68 4.53 5.31 4.50 4.47 3.25–3.25 0.75–0.75 .09<br />
Nov .07 .10 .58 2.72 3.80 4.63 5.38 4.51 4.39 3.25–3.25 0.75–0.75 .08<br />
Dec .07 .09 .69 2.90 3.89 4.62 5.38 4.55 4.37 3.25–3.25 0.75–0.75 .09<br />
2014: Jan .05 .07 .78 2.86 3.77 4.49 5.19 4.38 4.45 3.25–3.25 0.75–0.75 .07<br />
2 Yields on the more actively traded issues adjusted to constant maturities by the Department of the Treasury. The 30-year Treasury constant maturity series<br />
was discontinued on February 18, 2002, and reintroduced on February 9, 2006.<br />
3 Beginning with December 7, 2001, data for corporate Aaa series are industrial bonds only.<br />
4 Effective rate (in the primary market) on conventional mortgages, reflecting fees and charges as well as contract rate and assuming, on the average,<br />
repayment at end of 10 years. Rates beginning with January 1973 not strictly comparable with prior rates.<br />
5 For monthly data, high and low for the period. Prime rate for 1947–1948 are ranges of the rate in effect during the period.<br />
6 Primary credit replaced adjustment credit as the Federal Reserve’s principal discount window lending program effective January 9, 2003.<br />
7 Since July 19, 1975, the daily effective rate is an average of the rates on a given day weighted by the volume of transactions at these rates. Prior to that date,<br />
the daily effective rate was the rate considered most representative of the day’s transactions, usually the one at which most transactions occurred.<br />
8 From October 30, 1942 to April 24, 1946, a preferential rate of 0.50 percent was in effect for advances secured by Government securities maturing in one year<br />
or less.<br />
Sources: Department of the Treasury, Board of Governors of the Federal Reserve System, Federal Housing Finance Agency, Moody’s Investors Service, and<br />
Standard & Poor’s.<br />
Interest Rates, Money Stock, and Government Finance | 387