

1fAWAwx
1fAWAwx
1fAWAwx

You also want an ePaper? Increase the reach of your titles
YUMPU automatically turns print PDFs into web optimized ePapers that Google loves.
Year or quarter<br />
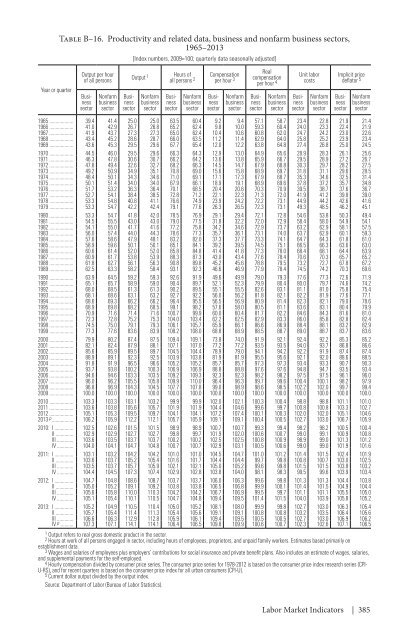
Table B–16. Productivity and related data, business and nonfarm business sectors,<br />
1965–2013<br />
Output per hour<br />
of all persons<br />
Business<br />
sector<br />
Nonfarm<br />
business<br />
sector<br />
Business<br />
sector<br />
[Index numbers, 2009=100; quarterly data seasonally adjusted]<br />
Output 1<br />
Nonfarm<br />
business<br />
sector<br />
Hours of<br />
all persons 2<br />
Business<br />
sector<br />
Nonfarm<br />
business<br />
sector<br />
Compensation<br />
per hour 3<br />
Business<br />
sector<br />
Nonfarm<br />
business<br />
sector<br />
Real<br />
compensation<br />
per hour 4<br />
Business<br />
sector<br />
Nonfarm<br />
business<br />
sector<br />
Business<br />
sector<br />
Unit labor<br />
costs<br />
Nonfarm<br />
business<br />
sector<br />
Implicit price<br />
deflator 5<br />
Business<br />
sector<br />
Nonfarm<br />
business<br />
sector<br />
1965 39.4 41.4 25.0 25.0 63.5 60.4 9.2 9.4 57.1 58.7 23.4 22.8 21.9 21.4<br />
1966 41.0 42.9 26.7 26.8 65.2 62.4 9.8 10.0 59.3 60.4 24.0 23.3 22.4 21.9<br />
1967 41.9 43.7 27.3 27.3 65.0 62.4 10.4 10.6 60.8 62.0 24.7 24.2 23.0 22.6<br />
1968 43.4 45.2 28.6 28.7 66.0 63.5 11.2 11.4 62.9 64.0 25.8 25.2 23.9 23.4<br />
1969 43.6 45.3 29.5 29.6 67.7 65.4 12.0 12.2 63.8 64.8 27.4 26.8 25.0 24.5<br />
1970 44.5 46.0 29.5 29.6 66.3 64.3 12.9 13.0 64.9 65.6 28.9 28.3 26.1 25.6<br />
1971 46.3 47.8 30.6 30.7 66.2 64.2 13.6 13.8 65.9 66.7 29.5 28.9 27.2 26.7<br />
1972 47.8 49.4 32.6 32.7 68.2 66.3 14.5 14.7 67.9 68.8 30.3 29.7 28.2 27.5<br />
1973 49.2 50.9 34.9 35.1 70.8 69.0 15.6 15.8 68.9 69.7 31.8 31.1 29.6 28.5<br />
1974 48.4 50.1 34.3 34.6 71.0 69.1 17.1 17.3 67.9 68.7 35.3 34.6 32.5 31.4<br />
1975 50.1 51.4 34.0 34.0 67.9 66.1 18.9 19.1 68.9 69.6 37.8 37.2 35.7 34.8<br />
1976 51.7 53.2 36.3 36.4 70.1 68.5 20.4 20.6 70.3 70.9 39.5 38.7 37.6 36.7<br />
1977 52.7 54.1 38.4 38.5 72.8 71.2 22.1 22.3 71.3 72.0 41.9 41.2 39.8 39.0<br />
1978 53.3 54.8 40.8 41.1 76.6 74.9 23.9 24.2 72.2 73.1 44.9 44.2 42.6 41.6<br />
1979 53.3 54.7 42.2 42.4 79.1 77.6 26.3 26.5 72.3 73.1 49.3 48.5 46.2 45.1<br />
1980 53.3 54.7 41.8 42.0 78.5 76.9 29.1 29.4 72.1 72.8 54.6 53.8 50.3 49.4<br />
1981 54.5 55.5 43.0 43.0 79.0 77.5 31.8 32.2 72.0 72.9 58.4 58.0 54.9 54.1<br />
1982 54.1 55.0 41.7 41.6 77.2 75.8 34.2 34.6 72.9 73.7 63.2 62.9 58.1 57.5<br />
1983 56.0 57.4 44.0 44.3 78.6 77.3 35.7 36.1 73.1 74.0 63.7 62.9 60.1 59.3<br />
1984 57.6 58.6 47.9 48.1 83.2 82.0 37.3 37.7 73.3 74.1 64.7 64.3 61.8 61.0<br />
1985 58.9 59.6 50.1 50.1 85.1 84.1 39.2 39.5 74.5 75.1 66.5 66.3 63.6 63.0<br />
1986 60.6 61.4 52.0 52.0 85.8 84.8 41.4 41.8 77.3 78.0 68.4 68.1 64.4 63.9<br />
1987 60.9 61.7 53.8 53.9 88.3 87.3 43.0 43.4 77.6 78.4 70.6 70.3 65.7 65.2<br />
1988 61.8 62.7 56.1 56.3 90.8 89.8 45.2 45.6 78.8 79.5 73.2 72.7 67.8 67.2<br />
1989 62.5 63.3 58.2 58.4 93.1 92.3 46.6 46.9 77.9 78.4 74.5 74.2 70.3 69.6<br />
1990 63.9 64.5 59.2 59.3 92.6 91.9 49.6 49.9 79.0 79.3 77.6 77.3 72.6 71.9<br />
1991 65.1 65.7 58.9 59.0 90.4 89.7 52.1 52.3 79.9 80.4 80.0 79.7 74.6 74.2<br />
1992 68.0 68.5 61.3 61.3 90.2 89.5 55.1 55.5 82.6 83.1 81.1 81.0 75.8 75.4<br />
1993 68.1 68.6 63.1 63.2 92.7 92.2 56.0 56.2 81.8 82.1 82.2 81.9 77.6 77.1<br />
1994 68.6 69.3 66.2 66.2 96.4 95.5 56.5 56.9 80.9 81.4 82.3 82.1 79.0 78.6<br />
1995 68.9 69.8 68.2 68.5 99.1 98.2 57.6 58.0 80.5 81.1 83.6 83.1 80.4 79.9<br />
1996 70.9 71.6 71.4 71.6 100.7 99.9 60.0 60.4 81.7 82.2 84.6 84.3 81.6 81.0<br />
1997 72.3 72.8 75.2 75.3 104.0 103.4 62.2 62.5 82.9 83.3 86.0 85.8 82.8 82.4<br />
1998 74.5 75.0 79.1 79.3 106.1 105.7 65.9 66.1 86.6 86.9 88.4 88.1 83.2 82.9<br />
1999 77.3 77.6 83.6 83.9 108.2 108.0 68.8 68.9 88.5 88.7 89.0 88.7 83.7 83.6<br />
2000 79.9 80.2 87.4 87.5 109.4 109.1 73.8 74.0 91.9 92.1 92.4 92.2 85.3 85.2<br />
2001 82.1 82.4 87.9 88.1 107.1 107.0 77.2 77.2 93.5 93.5 94.0 93.7 86.8 86.6<br />
2002 85.6 85.9 89.5 89.7 104.5 104.4 78.9 79.0 94.1 94.2 92.2 91.9 87.4 87.4<br />
2003 88.9 89.1 92.3 92.5 103.9 103.8 81.9 81.9 95.5 95.6 92.1 92.0 88.6 88.5<br />
2004 91.8 91.9 96.5 96.6 105.2 105.2 85.7 85.7 97.3 97.3 93.4 93.3 90.7 90.3<br />
2005 93.7 93.8 100.2 100.3 106.9 106.9 88.8 88.8 97.6 97.6 94.8 94.7 93.5 93.4<br />
2006 94.6 94.6 103.3 103.5 109.2 109.3 92.3 92.3 98.2 98.2 97.5 97.5 96.1 96.0<br />
2007 96.0 96.2 105.5 105.8 109.9 110.0 96.4 96.3 99.7 99.6 100.4 100.1 98.2 97.9<br />
2008 96.8 96.9 104.3 104.5 107.7 107.8 99.0 98.9 98.6 98.5 102.2 102.0 99.7 99.4<br />
2009 100.0 100.0 100.0 100.0 100.0 100.0 100.0 100.0 100.0 100.0 100.0 100.0 100.0 100.0<br />
2010 103.3 103.3 103.1 103.2 99.9 99.9 102.0 102.1 100.3 100.4 98.8 98.8 101.1 101.0<br />
2011 103.6 103.8 105.6 105.7 101.9 101.9 104.4 104.6 99.6 99.7 100.8 100.8 103.3 102.7<br />
2012 105.1 105.3 109.5 109.7 104.1 104.1 107.2 107.4 100.1 100.3 102.0 102.0 105.1 104.6<br />
2013 p 106.2 105.9 112.2 112.1 105.7 105.9 109.1 109.1 100.4 100.5 102.7 103.0 106.7 105.9<br />
2010: I 102.5 102.6 101.5 101.5 98.9 98.9 100.7 100.7 99.3 99.4 98.2 98.2 100.5 100.4<br />
II 102.9 102.9 102.7 102.7 99.8 99.7 101.9 102.0 100.6 100.7 99.0 99.1 100.9 100.8<br />
III 103.6 103.5 103.7 103.7 100.2 100.2 102.5 102.5 100.8 100.9 98.9 99.0 101.3 101.2<br />
IV 104.0 104.1 104.7 104.8 100.7 100.7 102.9 103.1 100.5 100.6 99.0 99.0 101.9 101.6<br />
2011: I 103.1 103.2 104.2 104.2 101.0 101.0 104.5 104.7 101.0 101.2 101.4 101.5 102.4 101.9<br />
II 103.6 103.7 105.2 105.4 101.6 101.7 104.4 104.4 99.7 99.8 100.8 100.7 103.0 102.5<br />
III 103.5 103.7 105.7 105.9 102.1 102.1 105.0 105.2 99.6 99.8 101.5 101.5 103.8 103.2<br />
IV 104.4 104.5 107.3 107.4 102.9 102.8 103.8 104.0 98.1 98.3 99.5 99.6 103.9 103.4<br />
2012: I 104.7 104.8 108.6 108.7 103.7 103.7 106.0 106.3 99.6 99.8 101.3 101.3 104.4 103.8<br />
II 105.0 105.2 109.1 109.2 103.8 103.8 106.5 106.8 99.9 100.1 101.4 101.5 104.9 104.4<br />
III 105.6 105.8 110.0 110.3 104.2 104.2 106.7 106.9 99.5 99.7 101.1 101.1 105.5 105.0<br />
IV 105.1 105.4 110.1 110.5 104.7 104.8 109.4 109.5 101.4 101.5 104.0 103.9 105.8 105.2<br />
2013: I 105.2 104.9 110.5 110.4 105.0 105.2 108.1 108.0 99.9 99.8 102.7 103.0 106.3 105.4<br />
II 105.7 105.4 111.4 111.3 105.4 105.6 109.1 109.1 100.8 100.8 103.2 103.5 106.4 105.6<br />
III <br />
IV p <br />
106.6<br />
107.3<br />
106.3<br />
107.1<br />
112.9<br />
114.1<br />
112.8<br />
114.1<br />
105.9<br />
106.4<br />
106.1<br />
106.5<br />
109.4<br />
109.8<br />
109.5<br />
109.9<br />
100.5<br />
100.6<br />
100.5<br />
100.7<br />
102.7<br />
102.3<br />
103.0<br />
102.6<br />
106.9<br />
107.1<br />
106.2<br />
106.5<br />
1 Output refers to real gross domestic product in the sector.<br />
2 Hours at work of all persons engaged in sector, including hours of employees, proprietors, and unpaid family workers. Estimates based primarily on<br />
establishment data.<br />
3 Wages and salaries of employees plus employers’ contributions for social insurance and private benefit plans. Also includes an estimate of wages, salaries,<br />
and supplemental payments for the self-employed.<br />
4 Hourly compensation divided by consumer price series. The consumer price series for 1978-2012 is based on the consumer price index research series (CPI-<br />
U-RS), and for recent quarters is based on the consumer price index for all urban consumers (CPI-U).<br />
5 Current dollar output divided by the output index.<br />
Source: Department of Labor (Bureau of Labor Statistics).<br />
Labor Market Indicators | 385