Year or month Table B–13. Unemployment by duration and reason, 1970–2014 [Thousands of persons, except as noted; monthly data seasonally adjusted 1 ] Less than 5 weeks 5–14 weeks Duration of unemployment 15–26 weeks 27 weeks and over Average (mean) duration (weeks) 2 Median duration (weeks) Total Job losers 3 On layoff Reason for unemployment Other Job leavers Unemployment Reentrants New entrants 1970 4,093 2,139 1,290 428 235 8.6 4.9 1,811 675 1,137 550 1,228 504 1971 5,016 2,245 1,585 668 519 11.3 6.3 2,323 735 1,588 590 1,472 630 1972 4,882 2,242 1,472 601 566 12.0 6.2 2,108 582 1,526 641 1,456 677 1973 4,365 2,224 1,314 483 343 10.0 5.2 1,694 472 1,221 683 1,340 649 1974 5,156 2,604 1,597 574 381 9.8 5.2 2,242 746 1,495 768 1,463 681 1975 7,929 2,940 2,484 1,303 1,203 14.2 8.4 4,386 1,671 2,714 827 1,892 823 1976 7,406 2,844 2,196 1,018 1,348 15.8 8.2 3,679 1,050 2,628 903 1,928 895 1977 6,991 2,919 2,132 913 1,028 14.3 7.0 3,166 865 2,300 909 1,963 953 1978 6,202 2,865 1,923 766 648 11.9 5.9 2,585 712 1,873 874 1,857 885 1979 6,137 2,950 1,946 706 535 10.8 5.4 2,635 851 1,784 880 1,806 817 1980 7,637 3,295 2,470 1,052 820 11.9 6.5 3,947 1,488 2,459 891 1,927 872 1981 8,273 3,449 2,539 1,122 1,162 13.7 6.9 4,267 1,430 2,837 923 2,102 981 1982 10,678 3,883 3,311 1,708 1,776 15.6 8.7 6,268 2,127 4,141 840 2,384 1,185 1983 10,717 3,570 2,937 1,652 2,559 20.0 10.1 6,258 1,780 4,478 830 2,412 1,216 1984 8,539 3,350 2,451 1,104 1,634 18.2 7.9 4,421 1,171 3,250 823 2,184 1,110 1985 8,312 3,498 2,509 1,025 1,280 15.6 6.8 4,139 1,157 2,982 877 2,256 1,039 1986 8,237 3,448 2,557 1,045 1,187 15.0 6.9 4,033 1,090 2,943 1,015 2,160 1,029 1987 7,425 3,246 2,196 943 1,040 14.5 6.5 3,566 943 2,623 965 1,974 920 1988 6,701 3,084 2,007 801 809 13.5 5.9 3,092 851 2,241 983 1,809 816 1989 6,528 3,174 1,978 730 646 11.9 4.8 2,983 850 2,133 1,024 1,843 677 1990 7,047 3,265 2,257 822 703 12.0 5.3 3,387 1,028 2,359 1,041 1,930 688 1991 8,628 3,480 2,791 1,246 1,111 13.7 6.8 4,694 1,292 3,402 1,004 2,139 792 1992 9,613 3,376 2,830 1,453 1,954 17.7 8.7 5,389 1,260 4,129 1,002 2,285 937 1993 8,940 3,262 2,584 1,297 1,798 18.0 8.3 4,848 1,115 3,733 976 2,198 919 1994 7,996 2,728 2,408 1,237 1,623 18.8 9.2 3,815 977 2,838 791 2,786 604 1995 7,404 2,700 2,342 1,085 1,278 16.6 8.3 3,476 1,030 2,446 824 2,525 579 1996 7,236 2,633 2,287 1,053 1,262 16.7 8.3 3,370 1,021 2,349 774 2,512 580 1997 6,739 2,538 2,138 995 1,067 15.8 8.0 3,037 931 2,106 795 2,338 569 1998 6,210 2,622 1,950 763 875 14.5 6.7 2,822 866 1,957 734 2,132 520 1999 5,880 2,568 1,832 755 725 13.4 6.4 2,622 848 1,774 783 2,005 469 2000 5,692 2,558 1,815 669 649 12.6 5.9 2,517 852 1,664 780 1,961 434 2001 6,801 2,853 2,196 951 801 13.1 6.8 3,476 1,067 2,409 835 2,031 459 2002 8,378 2,893 2,580 1,369 1,535 16.6 9.1 4,607 1,124 3,483 866 2,368 536 2003 8,774 2,785 2,612 1,442 1,936 19.2 10.1 4,838 1,121 3,717 818 2,477 641 2004 8,149 2,696 2,382 1,293 1,779 19.6 9.8 4,197 998 3,199 858 2,408 686 2005 7,591 2,667 2,304 1,130 1,490 18.4 8.9 3,667 933 2,734 872 2,386 666 2006 7,001 2,614 2,121 1,031 1,235 16.8 8.3 3,321 921 2,400 827 2,237 616 2007 7,078 2,542 2,232 1,061 1,243 16.8 8.5 3,515 976 2,539 793 2,142 627 2008 8,924 2,932 2,804 1,427 1,761 17.9 9.4 4,789 1,176 3,614 896 2,472 766 2009 14,265 3,165 3,828 2,775 4,496 24.4 15.1 9,160 1,630 7,530 882 3,187 1,035 2010 14,825 2,771 3,267 2,371 6,415 33.0 21.4 9,250 1,431 7,819 889 3,466 1,220 2011 13,747 2,677 2,993 2,061 6,016 39.3 21.4 8,106 1,230 6,876 956 3,401 1,284 2012 12,506 2,644 2,866 1,859 5,136 39.4 19.3 6,877 1,183 5,694 967 3,345 1,316 2013 11,460 2,584 2,759 1,807 4,310 36.5 17.0 6,073 1,136 4,937 932 3,207 1,247 2012: Jan 12,650 2,461 2,880 1,942 5,524 40.1 20.9 7,270 1,253 6,017 928 3,303 1,252 Feb 12,883 2,584 2,842 2,021 5,352 40.0 20.0 7,167 1,160 6,007 1,035 3,360 1,383 Mar 12,732 2,724 2,792 1,924 5,292 39.4 19.6 7,051 1,148 5,903 1,101 3,300 1,392 Apr 12,603 2,621 2,839 1,951 5,106 39.3 19.2 6,859 1,099 5,760 987 3,360 1,357 May 12,689 2,575 3,018 1,677 5,392 39.6 19.8 6,980 1,143 5,838 906 3,395 1,347 June 12,702 2,741 2,804 1,839 5,331 40.0 19.8 7,106 1,264 5,842 929 3,193 1,318 July 12,698 2,708 3,037 1,780 5,166 38.8 17.2 7,121 1,383 5,738 873 3,365 1,298 Aug 12,464 2,832 2,834 1,845 5,003 39.1 18.2 6,885 1,231 5,654 953 3,336 1,264 Sept 12,070 2,517 2,825 1,853 4,875 39.4 18.7 6,508 1,170 5,338 956 3,303 1,268 Oct 12,138 2,619 2,850 1,774 5,021 40.3 20.0 6,511 1,058 5,452 1,018 3,321 1,306 Nov 12,045 2,636 2,777 1,796 4,767 39.2 18.6 6,434 1,082 5,351 929 3,336 1,349 Dec 12,273 2,688 2,876 1,862 4,772 38.0 17.8 6,475 1,110 5,365 1,000 3,615 1,296 2013: Jan 12,315 2,753 3,077 1,867 4,707 35.4 16.0 6,675 1,164 5,511 984 3,520 1,274 Feb 12,047 2,677 2,788 1,735 4,750 36.9 17.7 6,495 1,091 5,404 952 3,330 1,276 Mar 11,706 2,497 2,843 1,779 4,576 37.0 18.1 6,321 1,118 5,204 978 3,182 1,304 Apr 11,683 2,491 2,844 1,969 4,360 36.6 17.3 6,367 1,179 5,188 857 3,131 1,268 May 11,690 2,704 2,642 1,934 4,353 36.9 16.9 6,094 980 5,114 944 3,326 1,257 June 11,747 2,665 2,848 1,892 4,325 35.7 16.2 6,089 1,195 4,894 1,034 3,240 1,250 July 11,408 2,548 2,826 1,786 4,246 36.7 15.8 5,894 1,197 4,697 970 3,234 1,246 Aug 11,256 2,527 2,738 1,704 4,269 37.0 16.5 5,887 1,059 4,828 890 3,116 1,295 Sept 11,203 2,571 2,685 1,802 4,125 36.8 16.4 5,803 1,091 4,712 984 3,165 1,211 Oct 11,140 2,794 2,636 1,777 4,047 36.0 16.5 6,162 1,507 4,655 842 3,104 1,217 Nov 10,841 2,439 2,585 1,742 4,044 37.1 17.0 5,731 1,128 4,603 890 3,065 1,169 Dec 10,351 2,255 2,506 1,651 3,878 37.1 17.1 5,366 997 4,369 862 3,036 1,201 2014: Jan 10,236 2,434 2,429 1,689 3,646 35.4 16.0 5,407 986 4,421 818 2,937 1,184 1 Because of independent seasonal adjustment of the various series, detail will not sum to totals. 2 Beginning with January 2011, includes unemployment durations of up to 5 years; prior data are for up to 2 years. 3 Beginning with January 1994, job losers and persons who completed temporary jobs. Note: Data relate to persons 16 years of age and over. See Note, Table B–11. Source: Department of Labor (Bureau of Labor Statistics). Labor Market Indicators | 381
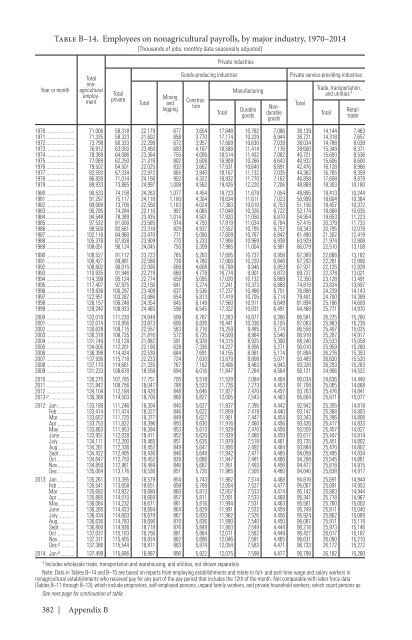
Table B–14. Employees on nonagricultural payrolls, by major industry, 1970–2014 [Thousands of jobs; monthly data seasonally adjusted] Year or month 382 | Appendix B Total private Total Mining and logging Private industries Goods-producing industries Total Manufacturing Durable goods Total nonagricultural employment Construction Nondurable goods Private service-providing industries Total Trade, transportation, and utilities 1 1970 71,006 58,318 22,179 677 3,654 17,848 10,762 7,086 36,139 14,144 7,463 1971 71,335 58,323 21,602 658 3,770 17,174 10,229 6,944 36,721 14,318 7,657 1972 73,798 60,333 22,299 672 3,957 17,669 10,630 7,039 38,034 14,788 8,038 1973 76,912 63,050 23,450 693 4,167 18,589 11,414 7,176 39,600 15,349 8,371 1974 78,389 64,086 23,364 755 4,095 18,514 11,432 7,082 40,721 15,693 8,536 1975 77,069 62,250 21,318 802 3,608 16,909 10,266 6,643 40,932 15,606 8,600 1976 79,502 64,501 22,025 832 3,662 17,531 10,640 6,891 42,476 16,128 8,966 1977 82,593 67,334 22,972 865 3,940 18,167 11,132 7,035 44,362 16,765 9,359 1978 86,826 71,014 24,156 902 4,322 18,932 11,770 7,162 46,858 17,658 9,879 1979 89,933 73,865 24,997 1,008 4,562 19,426 12,220 7,206 48,869 18,303 10,180 1980 90,533 74,158 24,263 1,077 4,454 18,733 11,679 7,054 49,895 18,413 10,244 1981 91,297 75,117 24,118 1,180 4,304 18,634 11,611 7,023 50,999 18,604 10,364 1982 89,689 73,706 22,550 1,163 4,024 17,363 10,610 6,753 51,156 18,457 10,372 1983 90,295 74,284 22,110 997 4,065 17,048 10,326 6,722 52,174 18,668 10,635 1984 94,548 78,389 23,435 1,014 4,501 17,920 11,050 6,870 54,954 19,653 11,223 1985 97,532 81,000 23,585 974 4,793 17,819 11,034 6,784 57,415 20,379 11,733 1986 99,500 82,661 23,318 829 4,937 17,552 10,795 6,757 59,343 20,795 12,078 1987 102,116 84,960 23,470 771 5,090 17,609 10,767 6,842 61,490 21,302 12,419 1988 105,378 87,838 23,909 770 5,233 17,906 10,969 6,938 63,929 21,974 12,808 1989 108,051 90,124 24,045 750 5,309 17,985 11,004 6,981 66,079 22,510 13,108 1990 109,527 91,112 23,723 765 5,263 17,695 10,737 6,958 67,389 22,666 13,182 1991 108,427 89,881 22,588 739 4,780 17,068 10,220 6,848 67,293 22,281 12,896 1992 108,802 90,015 22,095 689 4,608 16,799 9,946 6,853 67,921 22,125 12,828 1993 110,935 91,946 22,219 666 4,779 16,774 9,901 6,872 69,727 22,378 13,021 1994 114,398 95,124 22,774 659 5,095 17,020 10,132 6,889 72,350 23,128 13,491 1995 117,407 97,975 23,156 641 5,274 17,241 10,373 6,868 74,819 23,834 13,897 1996 119,836 100,297 23,409 637 5,536 17,237 10,486 6,751 76,888 24,239 14,143 1997 122,951 103,287 23,886 654 5,813 17,419 10,705 6,714 79,401 24,700 14,389 1998 126,157 106,248 24,354 645 6,149 17,560 10,911 6,649 81,894 25,186 14,609 1999 129,240 108,933 24,465 598 6,545 17,322 10,831 6,491 84,468 25,771 14,970 2000 132,019 111,230 24,649 599 6,787 17,263 10,877 6,386 86,581 26,225 15,280 2001 132,074 110,956 23,873 606 6,826 16,441 10,336 6,105 87,083 25,983 15,239 2002 130,628 109,115 22,557 583 6,716 15,259 9,485 5,774 86,558 25,497 15,025 2003 130,318 108,735 21,816 572 6,735 14,509 8,964 5,546 86,918 25,287 14,917 2004 131,749 110,128 21,882 591 6,976 14,315 8,925 5,390 88,246 25,533 15,058 2005 134,005 112,201 22,190 628 7,336 14,227 8,956 5,271 90,010 25,959 15,280 2006 136,398 114,424 22,530 684 7,691 14,155 8,981 5,174 91,894 26,276 15,353 2007 137,936 115,718 22,233 724 7,630 13,879 8,808 5,071 93,485 26,630 15,520 2008 137,170 114,661 21,335 767 7,162 13,406 8,463 4,943 93,326 26,293 15,283 2009 131,233 108,678 18,558 694 6,016 11,847 7,284 4,564 90,121 24,906 14,522 2010 130,275 107,785 17,751 705 5,518 11,528 7,064 4,464 90,034 24,636 14,440 2011 131,842 109,756 18,047 788 5,533 11,726 7,273 4,453 91,708 25,065 14,668 2012 134,104 112,184 18,420 848 5,646 11,927 7,470 4,457 93,763 25,476 14,841 2013 p 136,368 114,503 18,700 868 5,827 12,005 7,543 4,463 95,804 25,871 15,077 2012: Jan 133,188 111,246 18,304 840 5,627 11,837 7,395 4,442 92,942 25,355 14,818 Feb 133,414 111,474 18,327 846 5,622 11,859 7,419 4,440 93,147 25,368 14,803 Mar 133,657 111,720 18,377 849 5,627 11,901 7,447 4,454 93,343 25,396 14,808 Apr 133,753 111,822 18,396 850 5,630 11,916 7,460 4,456 93,426 25,417 14,833 May 133,863 111,953 18,394 853 5,613 11,928 7,470 4,458 93,559 25,457 14,827 June 133,951 112,028 18,411 852 5,620 11,939 7,480 4,459 93,617 25,447 14,814 July 134,111 112,200 18,465 851 5,635 11,979 7,518 4,461 93,735 25,451 14,802 Aug 134,261 112,336 18,452 849 5,647 11,956 7,492 4,464 93,884 25,470 14,802 Sept 134,422 112,495 18,436 846 5,648 11,942 7,477 4,465 94,059 25,495 14,834 Oct 134,647 112,750 18,452 839 5,666 11,947 7,481 4,466 94,298 25,545 14,861 Nov 134,850 112,961 18,484 846 5,687 11,951 7,493 4,458 94,477 25,618 14,915 Dec 135,064 113,176 18,536 851 5,720 11,965 7,505 4,460 94,640 25,638 14,917 2013: Jan 135,261 113,395 18,579 854 5,743 11,982 7,514 4,468 94,816 25,691 14,944 Feb 135,541 113,658 18,651 858 5,789 12,004 7,527 4,477 95,007 25,691 14,953 Mar 135,682 113,822 18,680 860 5,813 12,007 7,533 4,474 95,142 25,683 14,944 Apr 135,885 114,010 18,669 857 5,811 12,001 7,533 4,468 95,341 25,718 14,967 May 136,084 114,232 18,671 861 5,816 11,994 7,531 4,463 95,561 25,760 15,002 June 136,285 114,433 18,684 864 5,829 11,991 7,532 4,459 95,749 25,811 15,040 July 136,434 114,603 18,679 867 5,830 11,982 7,526 4,456 95,924 25,862 15,089 Aug 136,636 114,783 18,696 870 5,836 11,990 7,540 4,450 96,087 25,911 15,118 Sept 136,800 114,936 18,718 876 5,849 11,993 7,549 4,444 96,218 25,973 15,146 Oct 137,037 115,183 18,756 881 5,864 12,011 7,562 4,449 96,427 26,017 15,187 Nov 137,311 115,455 18,824 882 5,896 12,046 7,581 4,465 96,631 26,090 15,210 Dec p 137,386 115,544 18,811 883 5,874 12,054 7,583 4,471 96,733 26,172 15,272 2014: Jan p 137,499 115,686 18,887 890 5,922 12,075 7,598 4,477 96,799 26,182 15,260 1 Includes wholesale trade, transportation and warehousing, and utilities, not shown separately. Note: Data in Tables B–14 and B–15 are based on reports from employing establishments and relate to full- and part-time wage and salary workers in nonagricultural establishments who received pay for any part of the pay period that includes the 12th of the month. Not comparable with labor force data (Tables B–11 through B–13), which include proprietors, self-employed persons, unpaid family workers, and private household workers; which count persons as See next page for continuation of table. Total Retail trade
- Page 1 and 2:
ECONOMIC REPORT OF THE PRESIDENT To
- Page 4:
C O N T E N T S ECONOMIC REPORT OF
- Page 8 and 9:
economic report of the president To
- Page 10 and 11:
year-old. In the meantime, I’m go
- Page 12:
the annual report of the council of
- Page 16 and 17:
C O N T E N T S CHAPTER 1. PROMOTIN
- Page 18 and 19:
APPENDIX 1: COMPONENTS OF THE RECOV
- Page 20 and 21:
THE OBAMA ADMINISTRATION’S RECORD
- Page 22 and 23:
2.15. Housing Starts, 1960-2013....
- Page 24 and 25:
3.1. Forecasted and Actual Real GDP
- Page 26 and 27:
C H A P T E R 1 PROMOTING OPPORTUNI
- Page 28 and 29:
Opportunity, Growth, and Security i
- Page 30 and 31:
crisis—continue to rebound and co
- Page 32 and 33:
Figure 1-4 Real GDP Per Working-Age
- Page 34 and 35:
Figure 1-6 Change in Poverty Rate F
- Page 36 and 37:
Figure 1-7 Domestic Crude Oil Produ
- Page 38 and 39:
Figure 1-8 Growth in Real Per Capit
- Page 40 and 41:
Figure 1-9 Unemployment Rate by Dur
- Page 42 and 43:
e needed to make up for a decades-l
- Page 44 and 45:
Annual percent change 2.50 15-year
- Page 46 and 47:
Figure 1-14 Share of National Incom
- Page 48:
Along with steps that create jobs,
- Page 51 and 52:
corner, with purchases increasing d
- Page 53 and 54:
the four quarters of 2013, or enoug
- Page 55 and 56:
Percent of GDP 12 10 8 6 4 2 0 -2 -
- Page 57 and 58:
Percent 5.0 4.0 3.0 2.0 Figure 2-3
- Page 59 and 60:
In the euro area, the unemployment
- Page 61 and 62:
Figure 2-6 Cumulative Flows into Mu
- Page 63 and 64:
Figure 2-7 Household Deleveraging,
- Page 65 and 66:
Box 2-1: The 2013 Comprehensive Rev
- Page 67 and 68:
Percent 25 20 15 10 5 0 -5 Figure 2
- Page 69 and 70:
Figure 2-11 State and Local Pension
- Page 71 and 72:
Percent of GDP 2 1 0 Figure 2-14 Cu
- Page 73 and 74:
Box 2-2. Administration Trade Polic
- Page 75 and 76:
Upon completion, the TPP and T-TIP
- Page 77 and 78:
percent of households report that i
- Page 79 and 80:
Figure 2-18 Petroleum Net Imports,
- Page 81 and 82:
Figure 2-21 U.S. Per Capita Consump
- Page 83 and 84:
Percent 11 Figure 2-22 Unemployment
- Page 85 and 86:
Figure 2-25 Predicted vs. Actual Ma
- Page 87 and 88:
Box 2-4: Unemployment Duration and
- Page 89 and 90:
The Long-Term Outlook The 11-Year F
- Page 91 and 92:
Growth in GDP over the Long Term As
- Page 93 and 94:
Box 2-5: Immigration Reform and Pot
- Page 95 and 96:
Even with this growth, however, the
- Page 97 and 98:
families. The other half was for in
- Page 99 and 100:
ecause of rapidly declining stock a
- Page 101 and 102:
Obama Administration and the 111th
- Page 103 and 104:
Figure 3-1 Recovery Act Programs by
- Page 105 and 106:
other cases, new measures expanded
- Page 107 and 108:
Figure 3-2 Recovery Act and Subsequ
- Page 109 and 110:
Box 3-1: Other Administration Polic
- Page 111 and 112:
challenges, and how economists have
- Page 113 and 114:
Table 3-5 Estimated Output Multipli
- Page 115 and 116:
Figure 3-7 Quarterly Effect of the
- Page 117 and 118:
Table 3-6 Estimates of the Effects
- Page 119 and 120:
International Comparison The 2008 c
- Page 121 and 122:
Box 3-2: The U.S. Recovery in Compa
- Page 123 and 124:
Table 3-7 Tax Relief and Income Sup
- Page 125 and 126:
traditionally been jointly financed
- Page 127 and 128:
downturn in the economy. Even thoug
- Page 129 and 130:
Figure 3-11 Recovery Act Cumulative
- Page 131 and 132:
The Recovery Act also invested in r
- Page 133 and 134:
helped individuals who chose to ret
- Page 135 and 136:
the period, even though total power
- Page 137 and 138:
average—then the resulting increa
- Page 139 and 140:
Alternative Minimum Tax relief, bus
- Page 141 and 142:
Through the end of a Individual Tax
- Page 143 and 144:
y Poterba (1994), states and locali
- Page 145 and 146:
Table 3-11 Fiscal Support for the E
- Page 147 and 148:
spells. Because the resulting unemp
- Page 149 and 150:
literature uses two different appro
- Page 151 and 152:
Table 3-12 Summary of Cross-Section
- Page 153 and 154:
the CMS projections show real per-c
- Page 155 and 156:
will accrue to workers as higher wa
- Page 157 and 158:
Box 4-1: Two Measures of Growth in
- Page 159 and 160:
Figure 4-1 Growth in Real Per Capit
- Page 161 and 162:
in particular may not exactly track
- Page 163 and 164:
find that even those seniors who di
- Page 165 and 166:
the slowdown in real (that is, infl
- Page 167 and 168:
health care costs for an individual
- Page 169 and 170:
estimate for the ACA found that its
- Page 171 and 172:
Figure 4-4 Medicare 30-Day, All-Con
- Page 173 and 174:
agreements among the providers them
- Page 175 and 176:
payment for physician services, the
- Page 177 and 178:
Box 4-3: The Cost Slowdown and ACA
- Page 179 and 180:
2010a; 2011; 2012c; 2013a; 2014), w
- Page 181 and 182:
Figure 4-6 Recent CBO Projections o
- Page 183 and 184:
Conclusion The evidence is clear th
- Page 185 and 186:
facilitated this private-sector tec
- Page 187 and 188:
esulting gap between the actual gro
- Page 189 and 190:
Table 5-1 Sources of Productivity I
- Page 191 and 192:
Table 5-2 Nonfarm Private Business
- Page 193 and 194:
of the productivity improvement res
- Page 195 and 196:
Figure 5-3 Growth in Productivity a
- Page 197 and 198:
improving and college completion ra
- Page 199 and 200:
Box 5-2: Does Inequality Affect Pro
- Page 201 and 202:
Percent 3.5 Figure 5-5 Composition
- Page 203 and 204:
• Just two of the largest U.S. te
- Page 205 and 206:
Box 5-3: Just-in-Time Manufacturing
- Page 207 and 208:
Figure 5-7 Exclusive and Shared All
- Page 209 and 210:
Box 5-4: Spectrum Investment Polici
- Page 211 and 212:
To stimulate investment in more adv
- Page 213 and 214:
Because current uses of technology
- Page 215 and 216:
Box 5-5: Electronic Health Records
- Page 217 and 218:
about the array of services and sup
- Page 219 and 220:
and, in such cases, provides partie
- Page 221 and 222:
Box 5-6: The Leahy-Smith America In
- Page 223 and 224:
Box 5-7: Pay-For-Delay Settlements
- Page 226 and 227:
C H A P T E R 6 THE WAR ON POVERTY
- Page 228 and 229:
Measuring Poverty: Who is Poor in A
- Page 230 and 231:
thresholds ever since. These dollar
- Page 232 and 233:
of necessary items, including food,
- Page 234 and 235:
Table 6-1 Poverty Rates by Selected
- Page 236 and 237:
Box 6-3: Women and Poverty While wo
- Page 238 and 239:
However, this reflects smaller decl
- Page 240 and 241:
Percent 25 Figure 6-1 Trends in the
- Page 242 and 243:
Box 6-4: Social Programs Serve All
- Page 244 and 245:
of low- and middle-income workers a
- Page 246 and 247:
particularly valuable since they es
- Page 248 and 249:
Figure 6-4 Official vs Anchored Sup
- Page 250 and 251:
deep market poverty driven by the b
- Page 252 and 253:
work: in 2010, for example, unemplo
- Page 254 and 255:
out of poverty through job training
- Page 256 and 257:
e noted that researchers have found
- Page 258 and 259:
2012). Among the children of low-ea
- Page 260 and 261:
Education appears to be one of the
- Page 262 and 263:
Friedman, and Rockoff (2011) find t
- Page 264 and 265:
including an additional $25 a week
- Page 266 and 267:
Figure 6-11 Recovery Act and Subseq
- Page 268 and 269:
Empowering Every Child with a Quali
- Page 270 and 271:
modernize America’s high schools
- Page 272 and 273:
low-income Americans and their chil
- Page 274 and 275:
C H A P T E R 7 EVALUATION AS A TOO
- Page 276 and 277:
program evaluation efforts. For exa
- Page 278 and 279:
went to preschool would have had if
- Page 280 and 281:
y adopting successful interventions
- Page 282 and 283:
Box 7-2: Using Behavioral Economics
- Page 284 and 285:
Box 7-3: “Rapid Cycle” Evaluati
- Page 286 and 287:
Figure 7-1 Outlays for Grants to St
- Page 288 and 289:
performance data, fewer than half o
- Page 290 and 291:
Investment Act programs. The PROMIS
- Page 292 and 293:
Figure 7-2 Inventory of Beds for Ho
- Page 294 and 295:
example, included a nondiscretionar
- Page 296 and 297:
Other benefits of considering evalu
- Page 298 and 299:
with the treatment effect and thus
- Page 300 and 301:
unemployment insurance wage and ben
- Page 302 and 303:
hard for researchers to access for
- Page 304 and 305:
REFERENCES Chapter 1 Almunia, Migue
- Page 306 and 307:
____. 2014. “Press Release: Janua
- Page 308 and 309:
and the TPP at the Peterson Institu
- Page 310 and 311:
Increase Employment Evidence from t
- Page 312 and 313:
___. 2010b. “The Economic Impact
- Page 314 and 315:
___. 2012. World Economic Outlook A
- Page 316 and 317:
Polak Annual Research Conference. W
- Page 318 and 319:
Baicker, Katherine and Amitabh Chan
- Page 320 and 321:
Daly, Mary, Bart Hobijn, and Brian
- Page 322 and 323:
Nominal Wages,” International Jou
- Page 324 and 325:
Learning: A Meta-Analysis and Revie
- Page 326 and 327:
Chien, Colleen V. 2012. “Reformin
- Page 328 and 329:
GAO (Government Accountability Offi
- Page 330 and 331:
Jorgenson, Dale. 2001. “Informati
- Page 332 and 333:
Integration in Economic Development
- Page 334 and 335:
_____. 2007. “Improving the Safet
- Page 336 and 337: Dahl, Gordon B. and Lance Lochner.
- Page 338 and 339: Heckman, James J. and Dimitriy V. M
- Page 340 and 341: Ludwig, Jens and Douglas Miller. 20
- Page 342 and 343: Sharkey, Patrick. 2009. “Neighbor
- Page 344 and 345: _____. 2013. “Practical Evaluatio
- Page 346 and 347: www.nij.gov/topics/corrections/comm
- Page 348: Stock, James H., and Mark Watson. 2
- Page 352 and 353: letter of transmittal Council of Ec
- Page 354: Council Members and Their Dates of
- Page 357 and 358: The Members of the Council Betsey S
- Page 359 and 360: Act has had on reducing health care
- Page 361 and 362: Statistical Office The Statistical
- Page 364: A P P E N D I X B STATISTICAL TABLE
- Page 367 and 368: INTEREST RATES, MONEY STOCK, AND GO
- Page 369 and 370: 2013-to-2014 TABLE NUMBER MATCH 201
- Page 371 and 372: Year or quarter Table B-1. Percent
- Page 373 and 374: Table B-2. Gross domestic product,
- Page 375 and 376: Table B-3. Quantity and price index
- Page 377 and 378: Table B-5. Real exports and imports
- Page 379 and 380: Year Total 2 Table B-7. Real farm i
- Page 381 and 382: Table B-9. Median money income (in
- Page 383 and 384: Year or month Civilian noninstituti
- Page 385: Year or month All civilian workers
- Page 389 and 390: Table B-15. Hours and earnings in p
- Page 391 and 392: Year and month Interest Rates, Mone
- Page 393 and 394: Year and month Table B-18. Money st
- Page 395 and 396: Table B-20. Federal receipts, outla
- Page 397 and 398: Table B-22. Federal receipts, outla
- Page 399 and 400: Table B-24. State and local governm
- Page 401 and 402: End of month Table B-26. Estimated
- Page 403 and 404: B-7. Chain-type price indexes for g
- Page 405 and 406: B-28. National income by type of in
- Page 407 and 408: B-48. Employment cost index, privat
- Page 409 and 410: B-65. Producer price indexes by sta
- Page 411 and 412: B-81. Federal receipts, outlays, su
- Page 413 and 414: B-99. Farm output and productivity
- Page 415: B-111. International reserves Inter