- Page 1: National Microfinance Study of Sri
- Page 4 and 5: (b) Lenders .......................
- Page 6 and 7: Introduction into the pawning busin
- Page 8 and 9: Microfinance Overview .............
- Page 10 and 11: Savings ...........................
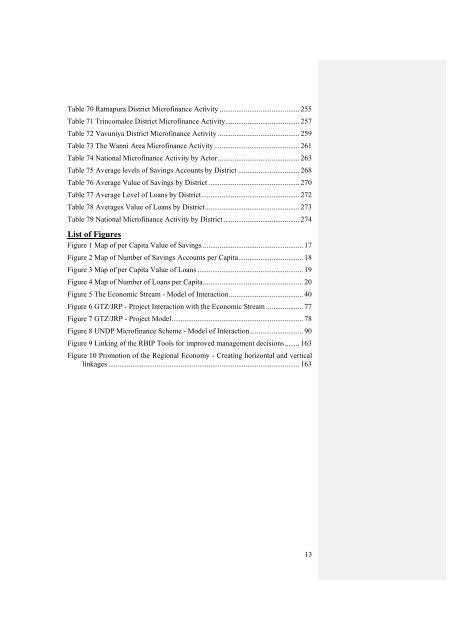
- Page 12 and 13: List of Tables Table 1 Microfinance
- Page 16 and 17: JBIC MFI MFN MIS MPCS MSME NCPPDP N
- Page 18 and 19: Figure 1 Map of per Capita Value of
- Page 20 and 21: Figure 3 Map of per Capita Value of
- Page 22 and 23: Executive Summary This report provi
- Page 24 and 25: Practitioner Microfinance Activity
- Page 26 and 27: As a result the banks are moving aw
- Page 28 and 29: The operating conditions of the con
- Page 30 and 31: Donor Strategies There should be a
- Page 32 and 33: Introduction to the Study The objec
- Page 34 and 35: The survey does not claim to repres
- Page 36 and 37: Introduction Socio-Economic Overvie
- Page 38 and 39: These five years saw a spate of new
- Page 40 and 41: The 'Economic Stream' Employment is
- Page 42 and 43: Microfinance Clients and Beneficiar
- Page 44 and 45: 1. Funders of Microfinance in Sri L
- Page 46 and 47: CIDA believes that microfinance act
- Page 48 and 49: The Department For International De
- Page 50 and 51: NOVIB Partnerships tend to be long
- Page 52 and 53: HIVOS The HIVOS Desk concentrates o
- Page 54 and 55: Over time SIDA noted that the loan
- Page 56 and 57: Comment freely given from one of th
- Page 58 and 59: the time period of the project, wit
- Page 60 and 61: Only a very small part of the US 50
- Page 62 and 63: The demand for loans from this fund
- Page 64 and 65:
Without permanent access to institu
- Page 66 and 67:
This broad strategy means that the
- Page 68 and 69:
Beneficiary targeting was generally
- Page 70 and 71:
The FCSs were developed the followi
- Page 72 and 73:
CARE's new strategy commits the org
- Page 74 and 75:
Each CBO determines the level of in
- Page 76 and 77:
The project’s overall approach re
- Page 78 and 79:
Figure 6 GTZ/JRP - Project Interact
- Page 80 and 81:
The Social Development Foundation F
- Page 82 and 83:
There are no sector-based quotas ap
- Page 84 and 85:
Over the past five years SCN has as
- Page 86 and 87:
UNDP in the North & East - The Jaff
- Page 88 and 89:
In December 2001 a new UNDP Program
- Page 90 and 91:
From previous experience and lesson
- Page 92 and 93:
World Vision Lanka WVL believes tha
- Page 94 and 95:
Membership Development 3500 3000 25
- Page 96 and 97:
Table 14 World Vision - Gramashakth
- Page 98 and 99:
ZOA works with community groups in
- Page 100 and 101:
At the village society and bank lev
- Page 102 and 103:
In Wayamba the sustainability of th
- Page 104 and 105:
Table 15 Badulla IRDP - Summary Dat
- Page 106 and 107:
DZPDP/WHRDA credit operations comme
- Page 108 and 109:
In the initial years they did not f
- Page 110 and 111:
Table 18 SPRDP- Loans 1993 to 1999
- Page 112 and 113:
(c)Lender-Practitioners The Central
- Page 114 and 115:
Society members have access to cred
- Page 116 and 117:
The RDBs were re-structured in 1998
- Page 118 and 119:
Table 25 Value of Loans Disbursed b
- Page 120 and 121:
The total savings and credit issued
- Page 122 and 123:
Table 29 Samurdhi - Loans by Distri
- Page 124 and 125:
In 1998 SEEDS converted to a separa
- Page 126 and 127:
Within the loans from SEEDS funds t
- Page 128 and 129:
The Arthacharya Foundation practice
- Page 130 and 131:
The program was assisted by some li
- Page 132 and 133:
However in general the majority of
- Page 134 and 135:
Table 33 Growth of MPCS CRBs -1990
- Page 136 and 137:
As at the end of December, 2000 a s
- Page 138 and 139:
Some 1,176 of the 1,476 Co-operativ
- Page 140 and 141:
A total of 74 NGOs were identified
- Page 142 and 143:
Finally only a small proportion of
- Page 144 and 145:
Table 38 TCCS Active Societies and
- Page 146 and 147:
District Unions - National Federati
- Page 148 and 149:
4. Facilitators a) National Level F
- Page 150 and 151:
International Centre for the Traini
- Page 152 and 153:
Funder-Practitioner Microfinance Ac
- Page 154 and 155:
As practitioner experience increase
- Page 156 and 157:
Introduction and Approach The major
- Page 158 and 159:
State-Owned Banks The Bank of Ceylo
- Page 160 and 161:
Starting in 1994, the NCRCS is aime
- Page 162 and 163:
The Seylan Bank The Seylan Bank ent
- Page 164 and 165:
Figure 9 Linking of the RBIP Tools
- Page 166 and 167:
People's Fast reduces loan processi
- Page 168 and 169:
In addition, RBIP monitors the impl
- Page 170 and 171:
The Hatton National Bank Case Study
- Page 172 and 173:
Seylan Bank Case Study The Seylan B
- Page 174 and 175:
Until 1961 private pawnbrokers were
- Page 176 and 177:
Bank officials stated that PSC staf
- Page 178 and 179:
The urban PSCs have on average more
- Page 180 and 181:
The lack of flexibility has induced
- Page 182 and 183:
From the borrowers perspective not
- Page 184 and 185:
The Peoples Bank, on the other hand
- Page 186 and 187:
Introduction and Approach Internati
- Page 188 and 189:
Displaced populations are dependent
- Page 190 and 191:
Large tracts of land have become to
- Page 192 and 193:
Public markets, shops, guest houses
- Page 194 and 195:
The previous thriving local economy
- Page 196 and 197:
The Wanni Access to the area known
- Page 198 and 199:
Remembering that these intervention
- Page 200 and 201:
This type of situation is seen thro
- Page 202 and 203:
People IDPs in welfare centres, sho
- Page 204 and 205:
World Vision has been working in al
- Page 206 and 207:
small entrepreneurs have received t
- Page 208 and 209:
The exception to this is a governme
- Page 210 and 211:
There has been some continued acces
- Page 212 and 213:
Introduction and Approach A distric
- Page 214 and 215:
The MPCSs were equally disrupted an
- Page 216 and 217:
The main body of the survey is pres
- Page 218 and 219:
Local NGOs 11 NGOs were identified
- Page 220 and 221:
Local NGOs 1 NGO was identified in
- Page 222 and 223:
Local NGOs 1 NGO was identified in
- Page 224 and 225:
Local NGOs 2 NGOs were identified i
- Page 226 and 227:
Local NGOs No NGOs were identified
- Page 228 and 229:
Gampaha District Microfinance Overv
- Page 230 and 231:
Hambantota District Microfinance Ov
- Page 232 and 233:
Jaffna District Microfinance Overvi
- Page 234 and 235:
Staring in 1998 each DS received SL
- Page 236 and 237:
Local NGOs 7 NGOs were identified i
- Page 238 and 239:
Local NGOs 6 NGOs were identified i
- Page 240 and 241:
Local NGOs 3 NGOs were identified i
- Page 242 and 243:
Local NGOs 2 NGOs were identified i
- Page 244 and 245:
Matale District Microfinance Overvi
- Page 246 and 247:
Matara District Microfinance Overvi
- Page 248 and 249:
Moneragala District Microfinance Ov
- Page 250 and 251:
Nuwara Eliya District Microfinance
- Page 252 and 253:
Polonnaruwa District Microfinance O
- Page 254 and 255:
Puttalam District Microfinance Over
- Page 256 and 257:
Ratnapura District Microfinance Ove
- Page 258 and 259:
Trincomalee District Microfinance O
- Page 260 and 261:
Vavuniya district Microfinance Over
- Page 262 and 263:
The Wanni Area Microfinance Overvie
- Page 264 and 265:
Summary Microfinance Activity by Ac
- Page 266 and 267:
The NGO questionnaire survey identi
- Page 268 and 269:
World Vision Lanka works in 5 distr
- Page 270 and 271:
Given that these figures do not inc
- Page 272 and 273:
Overall, 13 of districts had levels
- Page 274 and 275:
Averages Value of Loans Table 78 Av
- Page 276 and 277:
Volume and Number of Loans The surv
- Page 278 and 279:
Findings The key and main findings
- Page 280 and 281:
Service Providers The service provi
- Page 282 and 283:
those incapacitated by conflict, wi
- Page 284 and 285:
Cultures of Dependency in Microfina
- Page 286 and 287:
Strategic Recommendations The key s
- Page 288 and 289:
Conclusion The study found that the
- Page 290 and 291:
Charitoneko, S. and D de Silva (200
- Page 292 and 293:
Remenyi, J (1991). Where Credit is
- Page 294:
Technical Appendix


