As part of our commitment to rehabilitation of offenders, the ...
As part of our commitment to rehabilitation of offenders, the ...
As part of our commitment to rehabilitation of offenders, the ...
Create successful ePaper yourself
Turn your PDF publications into a flip-book with our unique Google optimized e-Paper software.
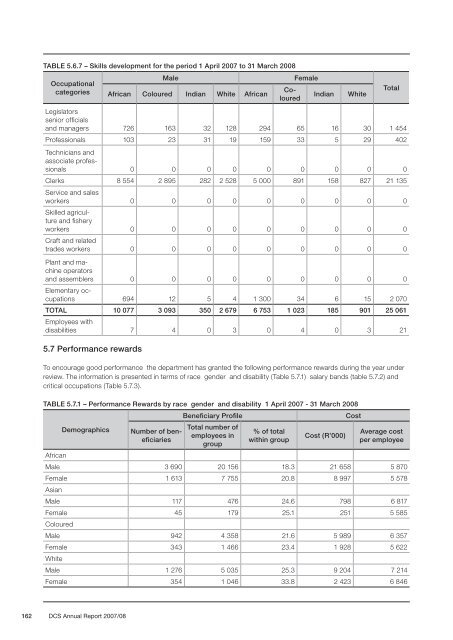
TABLE 5.6.7 – Skills development for <strong>the</strong> period 1 April 2007 <strong>to</strong> 31 March 2008<br />
Occupational<br />
categories<br />
162 DCS Annual Report 2007/08<br />
Male Female<br />
African Col<strong>our</strong>ed Indian White African<br />
Col<strong>our</strong>ed<br />
Indian White<br />
Legisla<strong>to</strong>rs<br />
senior <strong>of</strong>ficials<br />
and managers 726 163 32 128 294 65 16 30 1 454<br />
Pr<strong>of</strong>essionals 103 23 31 19 159 33 5 29 402<br />
Technicians and<br />
associate pr<strong>of</strong>essionals<br />
0 0 0 0 0 0 0 0 0<br />
Clerks 8 554 2 895 282 2 528 5 000 891 158 827 21 135<br />
Service and sales<br />
workers 0 0 0 0 0 0 0 0 0<br />
Skilled agriculture<br />
and fishery<br />
workers 0 0 0 0 0 0 0 0 0<br />
Craft and related<br />
trades workers 0 0 0 0 0 0 0 0 0<br />
Plant and machine<br />
opera<strong>to</strong>rs<br />
and assemblers 0 0 0 0 0 0 0 0 0<br />
Elementary occupations<br />
694 12 5 4 1 300 34 6 15 2 070<br />
TOTAL 10 077 3 093 350 2 679 6 753 1 023 185 901 25 061<br />
Employees with<br />
disabilities 7 4 0 3 0 4 0 3 21<br />
5.7 Performance rewards<br />
To enc<strong>our</strong>age good performance <strong>the</strong> de<strong>part</strong>ment has granted <strong>the</strong> following performance rewards during <strong>the</strong> year under<br />
review. The information is presented in terms <strong>of</strong> race gender and disability (Table 5.7.1) salary bands (table 5.7.2) and<br />
critical occupations (Table 5.7.3).<br />
TABLE 5.7.1 – Performance Rewards by race gender and disability 1 April 2007 - 31 March 2008<br />
African<br />
Demographics<br />
Number <strong>of</strong> beneficiaries<br />
Beneficiary Pr<strong>of</strong>ile Cost<br />
Total number <strong>of</strong><br />
employees in<br />
group<br />
% <strong>of</strong> <strong>to</strong>tal<br />
within group<br />
Cost (R’000)<br />
Total<br />
Average cost<br />
per employee<br />
Male 3 690 20 156 18.3 21 658 5 870<br />
Female 1 613 7 755 20.8 8 997 5 578<br />
<strong>As</strong>ian<br />
Male 117 476 24.6 798 6 817<br />
Female 45 179 25.1 251 5 585<br />
Col<strong>our</strong>ed<br />
Male 942 4 358 21.6 5 989 6 357<br />
Female 343 1 466 23.4 1 928 5 622<br />
White<br />
Male 1 276 5 035 25.3 9 204 7 214<br />
Female 354 1 046 33.8 2 423 6 846


