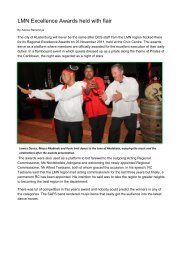
As part of our commitment to rehabilitation of offenders, the ...
As part of our commitment to rehabilitation of offenders, the ...
As part of our commitment to rehabilitation of offenders, the ...

You also want an ePaper? Increase the reach of your titles
YUMPU automatically turns print PDFs into web optimized ePapers that Google loves.
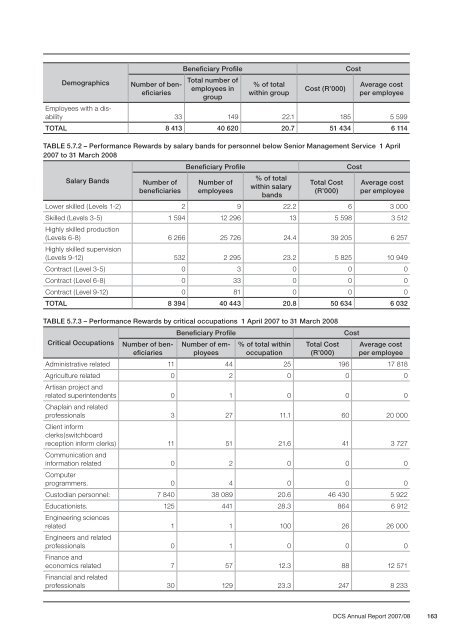
Demographics<br />
Number <strong>of</strong> beneficiaries<br />
Beneficiary Pr<strong>of</strong>ile Cost<br />
Total number <strong>of</strong><br />
employees in<br />
group<br />
% <strong>of</strong> <strong>to</strong>tal<br />
within group<br />
Cost (R’000)<br />
Average cost<br />
per employee<br />
Employees with a disability<br />
33 149 22.1 185 5 599<br />
TOTAL 8 413 40 620 20.7 51 434 6 114<br />
TABLE 5.7.2 – Performance Rewards by salary bands for personnel below Senior Management Service 1 April<br />
2007 <strong>to</strong> 31 March 2008<br />
Salary Bands<br />
Number <strong>of</strong><br />
beneficiaries<br />
Beneficiary Pr<strong>of</strong>ile Cost<br />
Number <strong>of</strong><br />
employees<br />
% <strong>of</strong> <strong>to</strong>tal<br />
within salary<br />
bands<br />
Total Cost<br />
(R’000)<br />
Average cost<br />
per employee<br />
Lower skilled (Levels 1-2) 2 9 22.2 6 3 000<br />
Skilled (Levels 3-5) 1 594 12 296 13 5 598 3 512<br />
Highly skilled production<br />
(Levels 6-8) 6 266 25 726 24.4 39 205 6 257<br />
Highly skilled supervision<br />
(Levels 9-12) 532 2 295 23.2 5 825 10 949<br />
Contract (Level 3-5) 0 3 0 0 0<br />
Contract (Level 6-8) 0 33 0 0 0<br />
Contract (Level 9-12) 0 81 0 0 0<br />
TOTAL 8 394 40 443 20.8 50 634 6 032<br />
TABLE 5.7.3 – Performance Rewards by critical occupations 1 April 2007 <strong>to</strong> 31 March 2008<br />
Critical Occupations<br />
Number <strong>of</strong> beneficiaries<br />
Beneficiary Pr<strong>of</strong>ile Cost<br />
Number <strong>of</strong> employees<br />
% <strong>of</strong> <strong>to</strong>tal within<br />
occupation<br />
Total Cost<br />
(R’000)<br />
Average cost<br />
per employee<br />
Administrative related 11 44 25 196 17 818<br />
Agriculture related 0 2 0 0 0<br />
Artisan project and<br />
related superintendents 0 1 0 0 0<br />
Chaplain and related<br />
pr<strong>of</strong>essionals 3 27 11.1 60 20 000<br />
Client inform<br />
clerks(switchboard<br />
reception inform clerks) 11 51 21.6 41 3 727<br />
Communication and<br />
information related 0 2 0 0 0<br />
Computer<br />
programmers. 0 4 0 0 0<br />
Cus<strong>to</strong>dian personnel: 7 840 38 089 20.6 46 430 5 922<br />
Educationists. 125 441 28.3 864 6 912<br />
Engineering sciences<br />
related 1 1 100 26 26 000<br />
Engineers and related<br />
pr<strong>of</strong>essionals 0 1 0 0 0<br />
Finance and<br />
economics related 7 57 12.3 88 12 571<br />
Financial and related<br />
pr<strong>of</strong>essionals 30 129 23.3 247 8 233<br />
DCS Annual Report 2007/08 163