As part of our commitment to rehabilitation of offenders, the ...
As part of our commitment to rehabilitation of offenders, the ...
As part of our commitment to rehabilitation of offenders, the ...

You also want an ePaper? Increase the reach of your titles
YUMPU automatically turns print PDFs into web optimized ePapers that Google loves.
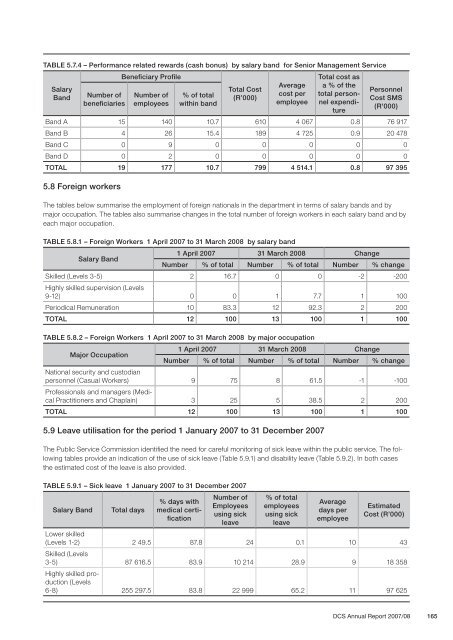
TABLE 5.7.4 – Performance related rewards (cash bonus) by salary band for Senior Management Service<br />
Salary<br />
Band<br />
Number <strong>of</strong><br />
beneficiaries<br />
Beneficiary Pr<strong>of</strong>ile<br />
Number <strong>of</strong><br />
employees<br />
% <strong>of</strong> <strong>to</strong>tal<br />
within band<br />
Total Cost<br />
(R’000)<br />
Average<br />
cost per<br />
employee<br />
Total cost as<br />
a % <strong>of</strong> <strong>the</strong><br />
<strong>to</strong>tal personnelexpenditure<br />
Personnel<br />
Cost SMS<br />
(R'000)<br />
Band A 15 140 10.7 610 4 067 0.8 76 917<br />
Band B 4 26 15.4 189 4 725 0.9 20 478<br />
Band C 0 9 0 0 0 0 0<br />
Band D 0 2 0 0 0 0 0<br />
TOTAL 19 177 10.7 799 4 514.1 0.8 97 395<br />
5.8 Foreign workers<br />
The tables below summarise <strong>the</strong> employment <strong>of</strong> foreign nationals in <strong>the</strong> de<strong>part</strong>ment in terms <strong>of</strong> salary bands and by<br />
major occupation. The tables also summarise changes in <strong>the</strong> <strong>to</strong>tal number <strong>of</strong> foreign workers in each salary band and by<br />
each major occupation.<br />
TABLE 5.8.1 – Foreign Workers 1 April 2007 <strong>to</strong> 31 March 2008 by salary band<br />
Salary Band<br />
1 April 2007 31 March 2008 Change<br />
Number % <strong>of</strong> <strong>to</strong>tal Number % <strong>of</strong> <strong>to</strong>tal Number % change<br />
Skilled (Levels 3-5) 2 16.7 0 0 -2 -200<br />
Highly skilled supervision (Levels<br />
9-12) 0 0 1 7.7 1 100<br />
Periodical Remuneration 10 83.3 12 92.3 2 200<br />
TOTAL 12 100 13 100 1 100<br />
TABLE 5.8.2 – Foreign Workers 1 April 2007 <strong>to</strong> 31 March 2008 by major occupation<br />
Major Occupation<br />
1 April 2007 31 March 2008 Change<br />
Number % <strong>of</strong> <strong>to</strong>tal Number % <strong>of</strong> <strong>to</strong>tal Number % change<br />
National security and cus<strong>to</strong>dian<br />
personnel (Casual Workers) 9 75 8 61.5 -1 -100<br />
Pr<strong>of</strong>essionals and managers (Medical<br />
Practitioners and Chaplain) 3 25 5 38.5 2 200<br />
TOTAL 12 100 13 100 1 100<br />
5.9 Leave utilisation for <strong>the</strong> period 1 January 2007 <strong>to</strong> 31 December 2007<br />
The Public Service Commission identified <strong>the</strong> need for careful moni<strong>to</strong>ring <strong>of</strong> sick leave within <strong>the</strong> public service. The following<br />
tables provide an indication <strong>of</strong> <strong>the</strong> use <strong>of</strong> sick leave (Table 5.9.1) and disability leave (Table 5.9.2). In both cases<br />
<strong>the</strong> estimated cost <strong>of</strong> <strong>the</strong> leave is also provided.<br />
TABLE 5.9.1 – Sick leave 1 January 2007 <strong>to</strong> 31 December 2007<br />
Salary Band Total days<br />
% days with<br />
medical certification<br />
Number <strong>of</strong><br />
Employees<br />
using sick<br />
leave<br />
% <strong>of</strong> <strong>to</strong>tal<br />
employees<br />
using sick<br />
leave<br />
Average<br />
days per<br />
employee<br />
Estimated<br />
Cost (R’000)<br />
Lower skilled<br />
(Levels 1-2) 2 49.5 87.8 24 0.1 10 43<br />
Skilled (Levels<br />
3-5) 87 616.5 83.9 10 214 28.9 9 18 358<br />
Highly skilled production<br />
(Levels<br />
6-8) 255 297.5 83.8 22 999 65.2 11 97 625<br />
DCS Annual Report 2007/08 165