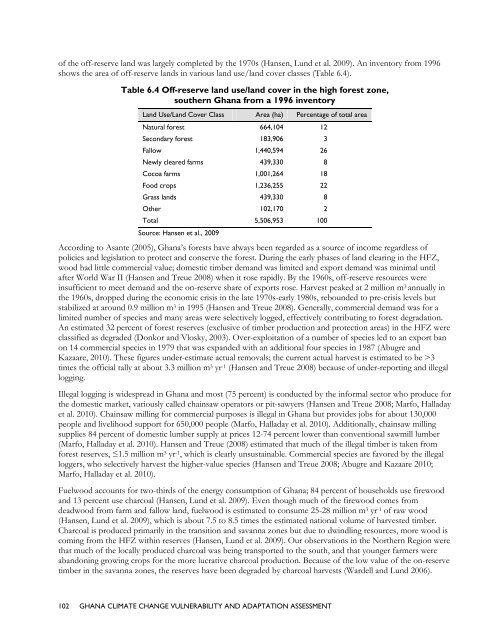
of the off-reserve l<strong>and</strong> was largely completed by the 1970s (Hansen, Lund et al. 2009). An inventory from 1996shows the area of off-reserve l<strong>and</strong>s in various l<strong>and</strong> use/l<strong>and</strong> cover classes (Table 6.4).Table 6.4 Off-reserve l<strong>and</strong> use/l<strong>and</strong> cover in the high forest zone,southern Ghana from a 1996 inventoryL<strong>and</strong> Use/L<strong>and</strong> Cover Class Area (ha) Percentage of total areaNatural forest 664,104 12Secondary forest 183,906 3Fallow 1,440,594 26Newly cleared farms 439,330 8Cocoa farms 1,001,264 18Food crops 1,236,255 22Grass l<strong>and</strong>s 439,330 8Other 102,170 2Total 5,506,953 100Source: Hansen et al., 2009According to Asante (2005), Ghana’s forests have always been regarded as a source of income regardless ofpolicies <strong>and</strong> legislation to protect <strong>and</strong> conserve the forest. During the early phases of l<strong>and</strong> clearing in the HFZ,wood had little commercial value; domestic timber dem<strong>and</strong> was limited <strong>and</strong> export dem<strong>and</strong> was minimal untilafter World War II (Hansen <strong>and</strong> Treue 2008) when it rose rapidly. By the 1960s, off-reserve resources wereinsufficient to meet dem<strong>and</strong> <strong>and</strong> the on-reserve share of exports rose. Harvest peaked at 2 million m 3 annually inthe 1960s, dropped during the economic crisis in the late 1970s-early 1980s, rebounded to pre-crisis levels butstabilized at around 0.9 million m 3 in 1995 (Hansen <strong>and</strong> Treue 2008). Generally, commercial dem<strong>and</strong> was for alimited number of species <strong>and</strong> many areas were selectively logged, effectively contributing to forest degradation.An estimated 32 percent of forest reserves (exclusive of timber production <strong>and</strong> protection areas) in the HFZ wereclassified as degraded (Donkor <strong>and</strong> Vlosky, 2003). Over-exploitation of a number of species led to an export banon 14 commercial species in 1979 that was exp<strong>and</strong>ed with an additional four species in 1987 (Abugre <strong>and</strong>Kazaare, 2010). These figures under-estimate actual removals; the current actual harvest is estimated to be >3times the official tally at about 3.3 million m 3 yr -1 (Hansen <strong>and</strong> Treue 2008) because of under-reporting <strong>and</strong> illegallogging.Illegal logging is widespread in Ghana <strong>and</strong> most (75 percent) is conducted by the informal sector who produce forthe domestic market, variously called chainsaw operators or pit-sawyers (Hansen <strong>and</strong> Treue 2008; Marfo, Halladayet al. 2010). Chainsaw milling for commercial purposes is illegal in Ghana but provides jobs for about 130,000people <strong>and</strong> livelihood support for 650,000 people (Marfo, Halladay et al. 2010). Additionally, chainsaw millingsupplies 84 percent of domestic lumber supply at prices 12-74 percent lower than conventional sawmill lumber(Marfo, Halladay et al. 2010). Hansen <strong>and</strong> Treue (2008) estimated that much of the illegal timber is taken fromforest reserves, ≤1.5 million m 3 yr -1 , which is clearly unsustainable. Commercial species are favored by the illegalloggers, who selectively harvest the higher-value species (Hansen <strong>and</strong> Treue 2008; Abugre <strong>and</strong> Kazaare 2010;Marfo, Halladay et al. 2010).Fuelwood accounts for two-thirds of the energy consumption of Ghana; 84 percent of households use firewood<strong>and</strong> 13 percent use charcoal (Hansen, Lund et al. 2009). Even though much of the firewood comes fromdeadwood from farm <strong>and</strong> fallow l<strong>and</strong>, fuelwood is estimated to consume 25-28 million m 3 yr -1 of raw wood(Hansen, Lund et al. 2009), which is about 7.5 to 8.5 times the estimated national volume of harvested timber.Charcoal is produced primarily in the transition <strong>and</strong> savanna zones but due to dwindling resources, more wood iscoming from the HFZ within reserves (Hansen, Lund et al. 2009). Our observations in the Northern Region werethat much of the locally produced charcoal was being transported to the south, <strong>and</strong> that younger farmers wereab<strong>and</strong>oning growing crops for the more lucrative charcoal production. Because of the low value of the on-reservetimber in the savanna zones, the reserves have been degraded by charcoal harvests (Wardell <strong>and</strong> Lund 2006).102 GHANA CLIMATE CHANGE VULNERABILITY AND ADAPTATION ASSESSMENT
Two other proximate causes of deforestation <strong>and</strong> degradation are mineral mining <strong>and</strong> wildfires (see subsequent).Artisanal gold mining has occurred for >500 years <strong>and</strong> indeed gave Ghana its colonial-era name of the GoldCoast. This pit mining, locally termed Galamsey mining, has contributed mostly to forest degradation. Industrialmining for gold <strong>and</strong> other minerals began in the late 1800s. Although mining within forest reserves is hotlydebated in Ghana <strong>and</strong> was briefly banned in 1997, anecdotal evidence is that some forest reserves have beenseverely degraded by Galamsey mining <strong>and</strong> would be open to industrial mining that has shifted from undergroundto surface mining (Hansen, Lund et al. 2009).Underlying causes of deforestation <strong>and</strong> degradation include macroeconomic, technological, demographic, <strong>and</strong>governance factors (Kanninen, Murdiyarso et al. 2007). Macroeconomic factors include the global dem<strong>and</strong> forprimary resources; for Ghana this has been cocoa, timber, <strong>and</strong> minerals (Asante 2005; Hansen, Lund et al. 2009).Various governmental policies, incentives, <strong>and</strong> tax exemptions have at one time or another favored theseindustries. Technological developments in these industries have also contributed to deforestation <strong>and</strong> degradation.New “sun-tolerant” cocoa varieties requiring less shade than the traditional varieties have prompted clearing oftrees on farms, especially in the cocoa-exp<strong>and</strong>ing western region of the HFZ (Hansen, Lund et al. 2009). As notedabove, the industrial mining industry has adopted new technologies for surface mining, thereby increasing theamount of forest removed in their operations.Ghana’s population has grown at a fast rate <strong>and</strong> is becoming increasingly urban through migration from rural tourban areas. The growing urban population has increased domestic dem<strong>and</strong> for construction wood, charcoal, <strong>and</strong>agricultural products; this dem<strong>and</strong> is met chiefly by increasing the area of productive l<strong>and</strong> rather than increasingthe productivity of already cleared l<strong>and</strong>. As noted above, most of the domestic dem<strong>and</strong> for construction materialcomes from illegal harvesting (Hansen <strong>and</strong> Treue 2008; Marfo, Halladay et al. 2010). Migration from the poorersavanna zones to the south has long been a reality in rural Ghana, dating from colonial days <strong>and</strong> before (Wardell,Reenberg et al. 2003). Over time, this seasonal <strong>and</strong> permanent labor migration has included the slave trade(international, regional, <strong>and</strong> national), regional trade in kola nuts <strong>and</strong> salt, export of mahogany, expansion ofcocoa, wild rubber, <strong>and</strong> public works construction. More recently there has been an exodus of young women tocities in the south to work in menial <strong>and</strong> domestic jobs. Another factor in the savanna zones has been vectors ofhuman <strong>and</strong> livestock diseases that have caused cycles of depopulation <strong>and</strong> repopulation that influencedeforestation <strong>and</strong> natural regeneration of savanna woodl<strong>and</strong>s <strong>and</strong> floodplain gallery forests (Wardell, Reenberg etal. 2003).Governance factors in Ghana are complex with customary or traditional rights overlain by often counteractingcolonial <strong>and</strong> post-independence impositions by the central government. Customary rights affect not only l<strong>and</strong>tenure but also tree tenure. Historically, much deforestation was driven by customary rules that granted usufructor use rights to l<strong>and</strong> by clearing virgin forest; this custom is common throughout West Africa. The customarychiefs (Stool, Skin, <strong>and</strong> lesser chiefs) managed the granting of these usufruct rights, including rights to certain treespecies such as mango <strong>and</strong> shea nut. As noted above, the colonial administration alienated the rights of about 20percent of the forest l<strong>and</strong> into gazetted reserves. The 1962 Concessions Act section 16 went further <strong>and</strong> vested allnatural forests <strong>and</strong> trees, on- <strong>and</strong> off-reserves, in the President in trust for the Stools <strong>and</strong> Skins. Management ofthis trust has devolved to the Forestry Commission (Wardell, Reenberg et al. 2003; Asante 2005; Hansen, Lund etal. 2009).Tree tenure <strong>and</strong> access to trees in Ghana is complex <strong>and</strong> the right that a person has for use or sale of a treedepends on whether it is planted or naturally regenerated; occurs on communal/family l<strong>and</strong> or rented l<strong>and</strong>; <strong>and</strong>how much of the tree is needed (branches or fruit versus whole tree) <strong>and</strong> whether it is meant for commercial ordomestic use (Marfo, Halladay et al. 2010). This means that a tree growing in a farmer’s field belongs to thefarmer if he/she planted it <strong>and</strong> can prove so with a certificate obtained from the Forestry Commission, butharvesting of that tree still requires a permit from the Commission. On the other h<strong>and</strong>, if that tree occurrednaturally <strong>and</strong> the l<strong>and</strong> is within a timber concession granted to a company by the Forestry Commission, thecompany can harvest that tree even if it means damaging the farmer’s crops, usually without any compensation tothe farmer because of low enforcement of rules by the Commission (Hansen, Lund et al. 2009; Hansen 2011).Community members can generally use parts of trees on communal l<strong>and</strong>s for domestic needs but cannot harvestGHANA CLIMATE CHANGE VULNERABILITY AND ADAPTATION ASSESSMENT 103
- Page 1 and 2:
GHANA CLIMATE CHANGEVULNERABILITY A
- Page 3:
GHANACLIMATE CHANGEVULNERABILITY AN
- Page 7 and 8:
ACRONYMSCAADPCBOCCCDCSCEACEPFCFMCIC
- Page 9:
NGONCRCNREGNRMNTFPPAPAMSCPPGRCRAMSA
- Page 13 and 14:
EXECUTIVE SUMMARYCountries in Afric
- Page 15 and 16:
precipitation changes is not very d
- Page 17 and 18:
AGRICULTURE AND LIVELIHOODSAgricult
- Page 19 and 20:
would include concentrating access
- Page 21 and 22:
of transparency pervade the current
- Page 23 and 24:
alternate energy sources (i.e., fos
- Page 25 and 26:
affecting carbon sequestration. Adv
- Page 27 and 28:
Information and analysis needs for
- Page 29 and 30:
1. INTRODUCTIONThe West African cou
- Page 31:
ABFigure 2.1 Two approaches to vuln
- Page 35 and 36:
Mean Annual Temperature (C)2928.528
- Page 37 and 38:
The UNDP-NSCP country-level climate
- Page 39 and 40:
For most eco-climatic zones, five-y
- Page 41 and 42:
increases generally were projected
- Page 43 and 44:
Table 3.2 Potential change in tempe
- Page 45 and 46:
parameter (temperature and precipit
- Page 47 and 48:
emission scenarios gives a decrease
- Page 49 and 50:
of finance and economic planning, f
- Page 51 and 52:
indigenous people and more recently
- Page 53 and 54:
Phase 1 REDD ReadinessConsultations
- Page 55 and 56:
SC. A New National Plantation Devel
- Page 57 and 58:
to be developed that provide rigoro
- Page 59 and 60:
LandownerTable 4.1 Land Ownership i
- Page 61 and 62:
ProblemTable 4.2 Problems Associate
- Page 63 and 64: TENURE CONSIDERATIONS IN LIGHT OF C
- Page 65 and 66: the south of the Ashanti Uplands re
- Page 67 and 68: Figure 5.1 Ecological Zones of Ghan
- Page 69 and 70: North latitude. Minia (2008) deline
- Page 71 and 72: Table 5.1 Percentage of producer ho
- Page 73 and 74: over a longer period. With the risk
- Page 75 and 76: LAND SUITABILITYThe CSIR-Soil Resea
- Page 77 and 78: Table 5.3 Crop Suitability by Soil
- Page 79 and 80: MAJOR CROPSMAIZEMaize is the most i
- Page 81 and 82: Source: Chamberlin, 2007, Figure 13
- Page 83 and 84: Total area(ha)MangroveswampTable 5.
- Page 85 and 86: Source: Chamberlin, 2007Figure 5.6
- Page 87 and 88: Farmers who depend on annual rains
- Page 89 and 90: Adjusting timing ofirrigationPricin
- Page 91 and 92: Transportation networkChanging Crop
- Page 93 and 94: Lower world food pricesAttitudes to
- Page 95 and 96: POPULATION AND ECONOMYGhana contain
- Page 97 and 98: Ghana is comprised of crop and live
- Page 99 and 100: URBAN VERSES RURAL LIVELIHOODS 3Liv
- Page 101 and 102: income; non-farm related enterprise
- Page 103 and 104: 6. VULNERABILITY TOCLIMATE CHANGETh
- Page 105 and 106: DESERTIFICATION“Desertification
- Page 107 and 108: In the National Action Plan to Comb
- Page 109 and 110: significantly recovered by the late
- Page 111 and 112: Source: Reich etal., 2001Figure 6.2
- Page 113: Source: US Geological Survey, (http
- Page 117 and 118: extreme, fire is essential in fire-
- Page 119 and 120: gill nets constructed from traditio
- Page 121 and 122: upwelling strength) involved in reg
- Page 123 and 124: completely dominate trawl catches b
- Page 125 and 126: have increased substantially due to
- Page 127 and 128: CategoryFishing effort andtechnolog
- Page 129 and 130: (Binet, 1995). Even if the declinin
- Page 131 and 132: METHODSAs described above, to asses
- Page 133 and 134: Indicator DescriptionDistance fromd
- Page 135 and 136: Indicator DescriptionUnimproveddrin
- Page 137 and 138: lowest vulnerability of any distric
- Page 139 and 140: Table 7.2 Social Vulnerability Inde
- Page 141 and 142: Table 7.5 Incidence of poverty (per
- Page 143 and 144: Table 7.6 Ghana District Names, Ref
- Page 145 and 146: Figure 7.4 Percentage of district p
- Page 147 and 148: Figure 7.6 Percentage of female-hea
- Page 149 and 150: Figure 7.8 Percentage of the Distri
- Page 151 and 152: Figure 7.10 Percentage of District
- Page 153 and 154: Figure 7.12 Percentage of District
- Page 155 and 156: Figure 7.14 Percentage of total Dis
- Page 157 and 158: people residing in thesee regions a
- Page 159 and 160: CASE STUDY: CLIMATE CHANGE ADAPTATI
- Page 161 and 162: from friends and family to get by d
- Page 163 and 164: CASE STUDY: CLIMATE CHANGE ADAPTATI
- Page 165 and 166:
At Mole National Park, managers exp
- Page 167 and 168:
ADAPTING TO CLIMATE CHANGE IN THE N
- Page 169 and 170:
(interview). An opportunity exists
- Page 171 and 172:
Upper West Region, 69.8 percent of
- Page 173 and 174:
Brong-Ahafo Region that entails ref
- Page 175 and 176:
Ghana Limited, 2009). Given the con
- Page 177 and 178:
positive impacts, and has upset com
- Page 179 and 180:
Basin (total area 416,382km 2 ) lie
- Page 181 and 182:
effect. In the drier scenario, the
- Page 183 and 184:
Communities are, rightly or wrongly
- Page 185 and 186:
carbon sequestration and maintenanc
- Page 187 and 188:
Information and analysis needs for
- Page 189 and 190:
Table 11.1 Options for intervention
- Page 191 and 192:
Barriers toAdaptation andMitigation
- Page 193 and 194:
Barriers toAdaptation andMitigation
- Page 195 and 196:
Barriers toAdaptation andMitigation
- Page 197 and 198:
Amanor, K.S. 2001. Share contracts
- Page 199 and 200:
Braimoh, A. and P. Vlek (2006). "So
- Page 201 and 202:
Energy Commission. 2005. Strategic
- Page 203 and 204:
Gyau-Boakye P., and Tumbulto J.W. 2
- Page 205 and 206:
Koranteng, K.A. 1995. The Ghanaian
- Page 207 and 208:
MSE (Ministry of Science and Agricu
- Page 209 and 210:
Rubin, J.A.; Gordon, C.; Amatekpor,
- Page 211 and 212:
Wagner, M.R. and Cobbinah, J.R., 19
- Page 213 and 214:
Date Organization Interviewee Posit
- Page 215 and 216:
Date Organization Interviewee Posit
- Page 217 and 218:
Date Organization Interviewee Posit
- Page 219 and 220:
APPENDIX 2. TEAM MEMBERSName Role B
- Page 221 and 222:
DP - contact person Activity Object
- Page 223 and 224:
DP - contact person Activity Object
- Page 225 and 226:
DP - contact person Activity Object
- Page 227 and 228:
DP - contact person Activity Object
- Page 229 and 230:
OrganizationNameInstitutional objec
- Page 231 and 232:
OrganizationNameInstitutional objec
- Page 233 and 234:
OrganizationNameInstitutional objec
- Page 235 and 236:
OrganizationNameInstitutional objec
- Page 237 and 238:
OrganizationNameInstitutional objec
- Page 239 and 240:
OrganizationNameInstitutional objec
- Page 241 and 242:
APPENDIX 5. SCENARIOS OF TEMPERATUR
- Page 243 and 244:
e. RAIN FOREST ZONEBaseline Mean Te
- Page 245 and 246:
Aug 191.5 16 12.0 -0.1 -0.5 -1.0 19
- Page 247 and 248:
Feb 25.6 3 9.4 -9.1 -29.7 -58.9 23.
- Page 249 and 250:
c. TRANSITIONAL ZONEBaseline Mean T
- Page 251 and 252:
APPENDIX 8. SCENARIOS OF CHANGES IN
- Page 253 and 254:
d. DECIDUOUS FOREST ZONEBaseline Me
- Page 255 and 256:
APPENDIX 9. SCENARIOS OF MEAN SEA S
- Page 258:
U.S. Agency for International Devel