ghana climate change vulnerability and adaptation assessment
ghana climate change vulnerability and adaptation assessment
ghana climate change vulnerability and adaptation assessment
- No tags were found...

You also want an ePaper? Increase the reach of your titles
YUMPU automatically turns print PDFs into web optimized ePapers that Google loves.
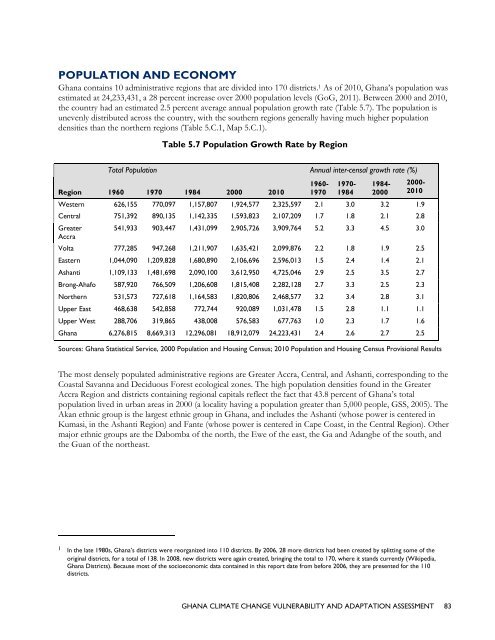
POPULATION AND ECONOMYGhana contains 10 administrative regions that are divided into 170 districts. 1 As of 2010, Ghana’s population wasestimated at 24,233,431, a 28 percent increase over 2000 population levels (GoG, 2011). Between 2000 <strong>and</strong> 2010,the country had an estimated 2.5 percent average annual population growth rate (Table 5.7). The population isunevenly distributed across the country, with the southern regions generally having much higher populationdensities than the northern regions (Table 5.C.1, Map 5.C.1).Table 5.7 Population Growth Rate by RegionTotal Population Annual inter-censal growth rate (%)1960- 1970- 1984- 2000-Region 1960 1970 1984 2000 2010 1970 1984 2000 2010Western 626,155 770,097 1,157,807 1,924,577 2,325,597 2.1 3.0 3.2 1.9Central 751,392 890,135 1,142,335 1,593,823 2,107,209 1.7 1.8 2.1 2.8GreaterAccra541,933 903,447 1,431,099 2,905,726 3,909,764 5.2 3.3 4.5 3.0Volta 777,285 947,268 1,211,907 1,635,421 2,099,876 2.2 1.8 1.9 2.5Eastern 1,044,090 1,209,828 1,680,890 2,106,696 2,596,013 1.5 2.4 1.4 2.1Ashanti 1,109,133 1,481,698 2,090,100 3,612,950 4,725,046 2.9 2.5 3.5 2.7Brong-Ahafo 587,920 766,509 1,206,608 1,815,408 2,282,128 2.7 3.3 2.5 2.3Northern 531,573 727,618 1,164,583 1,820,806 2,468,577 3.2 3.4 2.8 3.1Upper East 468,638 542,858 772,744 920,089 1,031,478 1.5 2.8 1.1 1.1Upper West 288,706 319,865 438,008 576,583 677,763 1.0 2.3 1.7 1.6Ghana 6,276,815 8,669,313 12,296,081 18,912,079 24,223,431 2.4 2.6 2.7 2.5Sources: Ghana Statistical Service, 2000 Population <strong>and</strong> Housing Census; 2010 Population <strong>and</strong> Housing Census Provisional ResultsThe most densely populated administrative regions are Greater Accra, Central, <strong>and</strong> Ashanti, corresponding to theCoastal Savanna <strong>and</strong> Deciduous Forest ecological zones. The high population densities found in the GreaterAccra Region <strong>and</strong> districts containing regional capitals reflect the fact that 43.8 percent of Ghana’s totalpopulation lived in urban areas in 2000 (a locality having a population greater than 5,000 people, GSS, 2005). TheAkan ethnic group is the largest ethnic group in Ghana, <strong>and</strong> includes the Ashanti (whose power is centered inKumasi, in the Ashanti Region) <strong>and</strong> Fante (whose power is centered in Cape Coast, in the Central Region). Othermajor ethnic groups are the Dabomba of the north, the Ewe of the east, the Ga <strong>and</strong> Adangbe of the south, <strong>and</strong>the Guan of the northeast.1 In the late 1980s, Ghana’s districts were reorganized into 110 districts. By 2006, 28 more districts had been created by splitting some of theoriginal districts, for a total of 138. In 2008, new districts were again created, bringing the total to 170, where it st<strong>and</strong>s currently (Wikipedia,Ghana Districts). Because most of the socioeconomic data contained in this report date from before 2006, they are presented for the 110districts.GHANA CLIMATE CHANGE VULNERABILITY AND ADAPTATION ASSESSMENT 83