ghana climate change vulnerability and adaptation assessment
ghana climate change vulnerability and adaptation assessment
ghana climate change vulnerability and adaptation assessment
- No tags were found...

Create successful ePaper yourself
Turn your PDF publications into a flip-book with our unique Google optimized e-Paper software.
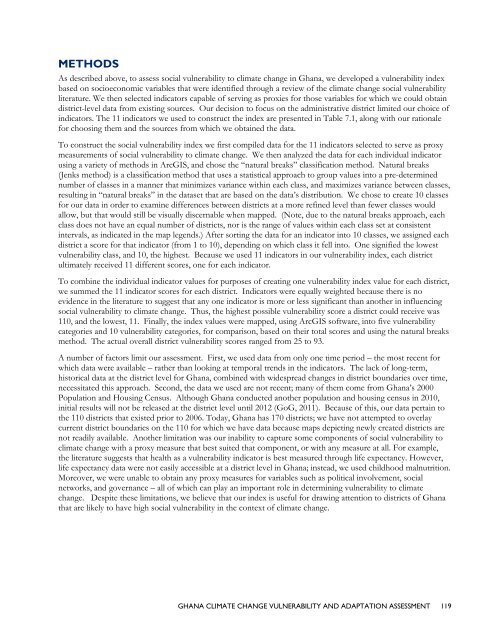
METHODSAs described above, to assess social <strong>vulnerability</strong> to <strong>climate</strong> <strong>change</strong> in Ghana, we developed a <strong>vulnerability</strong> indexbased on socioeconomic variables that were identified through a review of the <strong>climate</strong> <strong>change</strong> social <strong>vulnerability</strong>literature. We then selected indicators capable of serving as proxies for those variables for which we could obtaindistrict-level data from existing sources. Our decision to focus on the administrative district limited our choice ofindicators. The 11 indicators we used to construct the index are presented in Table 7.1, along with our rationalefor choosing them <strong>and</strong> the sources from which we obtained the data.To construct the social <strong>vulnerability</strong> index we first compiled data for the 11 indicators selected to serve as proxymeasurements of social <strong>vulnerability</strong> to <strong>climate</strong> <strong>change</strong>. We then analyzed the data for each individual indicatorusing a variety of methods in ArcGIS, <strong>and</strong> chose the “natural breaks” classification method. Natural breaks(Jenks method) is a classification method that uses a statistical approach to group values into a pre-determinednumber of classes in a manner that minimizes variance within each class, <strong>and</strong> maximizes variance between classes,resulting in “natural breaks” in the dataset that are based on the data’s distribution. We chose to create 10 classesfor our data in order to examine differences between districts at a more refined level than fewer classes wouldallow, but that would still be visually discernable when mapped. (Note, due to the natural breaks approach, eachclass does not have an equal number of districts, nor is the range of values within each class set at consistentintervals, as indicated in the map legends.) After sorting the data for an indicator into 10 classes, we assigned eachdistrict a score for that indicator (from 1 to 10), depending on which class it fell into. One signified the lowest<strong>vulnerability</strong> class, <strong>and</strong> 10, the highest. Because we used 11 indicators in our <strong>vulnerability</strong> index, each districtultimately received 11 different scores, one for each indicator.To combine the individual indicator values for purposes of creating one <strong>vulnerability</strong> index value for each district,we summed the 11 indicator scores for each district. Indicators were equally weighted because there is noevidence in the literature to suggest that any one indicator is more or less significant than another in influencingsocial <strong>vulnerability</strong> to <strong>climate</strong> <strong>change</strong>. Thus, the highest possible <strong>vulnerability</strong> score a district could receive was110, <strong>and</strong> the lowest, 11. Finally, the index values were mapped, using ArcGIS software, into five <strong>vulnerability</strong>categories <strong>and</strong> 10 <strong>vulnerability</strong> categories, for comparison, based on their total scores <strong>and</strong> using the natural breaksmethod. The actual overall district <strong>vulnerability</strong> scores ranged from 25 to 93.A number of factors limit our <strong>assessment</strong>. First, we used data from only one time period – the most recent forwhich data were available – rather than looking at temporal trends in the indicators. The lack of long-term,historical data at the district level for Ghana, combined with widespread <strong>change</strong>s in district boundaries over time,necessitated this approach. Second, the data we used are not recent; many of them come from Ghana’s 2000Population <strong>and</strong> Housing Census. Although Ghana conducted another population <strong>and</strong> housing census in 2010,initial results will not be released at the district level until 2012 (GoG, 2011). Because of this, our data pertain tothe 110 districts that existed prior to 2006. Today, Ghana has 170 districts; we have not attempted to overlaycurrent district boundaries on the 110 for which we have data because maps depicting newly created districts arenot readily available. Another limitation was our inability to capture some components of social <strong>vulnerability</strong> to<strong>climate</strong> <strong>change</strong> with a proxy measure that best suited that component, or with any measure at all. For example,the literature suggests that health as a <strong>vulnerability</strong> indicator is best measured through life expectancy. However,life expectancy data were not easily accessible at a district level in Ghana; instead, we used childhood malnutrition.Moreover, we were unable to obtain any proxy measures for variables such as political involvement, socialnetworks, <strong>and</strong> governance – all of which can play an important role in determining <strong>vulnerability</strong> to <strong>climate</strong><strong>change</strong>. Despite these limitations, we believe that our index is useful for drawing attention to districts of Ghanathat are likely to have high social <strong>vulnerability</strong> in the context of <strong>climate</strong> <strong>change</strong>.GHANA CLIMATE CHANGE VULNERABILITY AND ADAPTATION ASSESSMENT 119